- Home
- Forum
- ASP.NET Core - EJ 2
- Chips On Click Event
Chips On Click Event
Trying to update the primary axis to toggle between Session as X axis vs Date as X axis.

Essentially I have a graph that needs to be displayed either by date or session count and want to toggle it with a chip.
@{
var chipSelection = 0;
}
<ejs-chiplist id="chip-choice" selection="Single" cssClass="e-outline" selectedChips="chipSelection" click="selection" >
<e-chips>
<e-chip text="Session" leadingIconCss="text" enabled="true"></e-chip>
<e-chip text="Date" leadingIconCss="alarm" enabled="true"></e-chip>
</e-chips>
</ejs-chiplist>
<div style="margin: 10px;">
<ejs-chart id="sessionGraph" title="@Model.ClientMeasure.MeasureTypeName of @Model.ClientMeasure.MeasureName" >
<e-chart-tooltipsettings enable="true">
</e-chart-tooltipsettings>
<e-chart-primaryxaxis valueType="Category" Title="Session"
@*labelFormat="MM-dd-yy" this is for date showing*@
intervalType="Auto"
edgeLabelPlacement="Shift" labelRotation="-45">
<e-majorgridlines width="0"></e-majorgridlines>
</e-chart-primaryxaxis>
<e-chart-primaryyaxis labelFormat="{value}" title="@Model.ClientMeasure.MeasureTypeDescription"
rangePadding="None"
>
<e-linestyle width="0"></e-linestyle>
<e-majorticklines width="0"></e-majorticklines>
</e-chart-primaryyaxis>
<e-chart-chartarea>
<e-chartarea-border width="0"></e-chartarea-border>
</e-chart-chartarea>
<e-series-collection>
<e-series dataSource="@Model.RateData" name="Measure" xName="SessionNumber" fill="#@Model.ClientMeasure.Hex"
width="2" opacity="1" yName="Count" type="@Syncfusion.EJ2.Charts.ChartSeriesType.Line" >
<e-series-marker visible="true" height="10" width="10" fill="#@Model.ClientMeasure.Hex"></e-series-marker>
</e-series>
</e-series-collection>
</ejs-chart>
</div>
<script type="text/javascript">
function selection(args) {
if (@chipSelection === 1) {
document.getElementById("sessionGraph").style.display = 'none';
} else {
document.getElementById("sessionGraph").style.display = 'block';
}
}
</script>
How can I use the chip toggle to update the primary axis values?
Thanks.
SIGN IN To post a reply.
3 Replies
VK
Vinoth Kumar Sundara Moorthy
Syncfusion Team
August 2, 2019 12:03 PM UTC
Hi Mark,
Thank you for contacting Syncfusion support.
Query #1: How can I use the chip toggle to update the primary axis values?
We have analyzed your query “To use the chip toggle to update the primary axis values” and it can be achieved by using selected chip text value. If text is Session, then assign numeric values or else if text value isDate, then assign DateTime value to the chart dataSource as like in the below code example,
Code Example
|
function selection(args) {
var chart = document.getElementById("sessionGraph").ej2_instances[0];
if (args.data.text == 'Session') {
chart.primaryXAxis.valueType = 'Category';
chart.primaryXAxis.labelFormat = '';
chart.series[0].dataSource = [
{ x: 10, y: 22 }, { x: 20, y: 16 },
{ x: 30, y: 32 }, { x: 40, y: 18 },
];
chart.series[0].xName = 'x';
chart.series[0].yName = 'y';
chart.refresh();
} else {
chart.primaryXAxis.valueType = 'DateTime';
chart.primaryXAxis.labelFormat = 'MM-dd-yy';
chart.series[0].dataSource = [
{ x: new Date(2005, 0, 1), y: 21 }, { x: new Date(2006, 0, 1), y: 24 },
{ x: new Date(2007, 0, 1), y: 36 }, { x: new Date(2008, 0, 1), y: 38 },
{ x: new Date(2009, 0, 1), y: 54 }, { x: new Date(2010, 0, 1), y: 57 },
{ x: new Date(2011, 0, 1), y: 70 }
]
chart.series[0].xName = 'x';
chart.series[0].yName = 'y';
chart.refresh();
}
} |
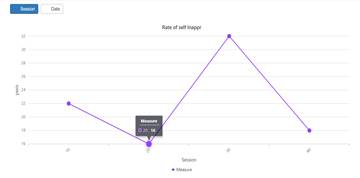
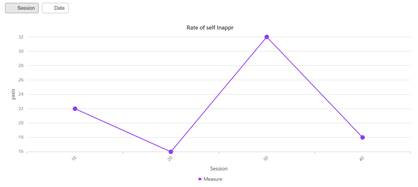
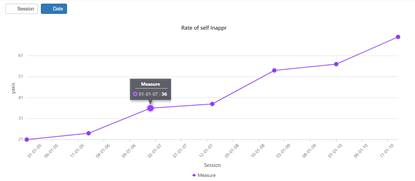
Screenshot:
|
Initial Rendering |
Session |
Date |
 |
 |
 |
For your convenience, we have prepared a sample based on your requirement and in below sample we have assigned axis valueType and dataSource based on selected text values to update the axis values using chip toggle,
Could you please check the above details and get back to us, if you need further assistance on this?
Regards,
Vinoth Kumar S
UN
Unknown
Syncfusion Team
August 9, 2019 08:04 PM UTC
Thank you kindly. This worked as needed.
VK
Vinoth Kumar Sundara Moorthy
Syncfusion Team
August 12, 2019 08:15 AM UTC
Hi Mark,
You are most welcome. Please feel free to contact us if you need any further assistance on Syncfusion components.
Regards,
Vinoth Kumar S
SIGN IN To post a reply.
- 3 Replies
- 2 Participants
-
UN Unknown

- Jul 31, 2019 07:07 PM UTC
- Aug 12, 2019 08:15 AM UTC
