We use cookies to give you the best experience on our website. If you continue to browse, then you agree to our privacy policy and cookie policy. Image for the cookie policy date

Annotation Label Position

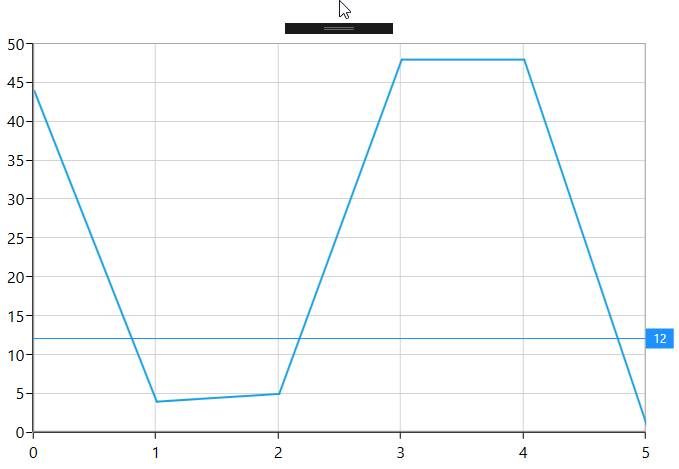
Using HorizontalLineAnnotation and ShowAxisLabel (and showline =false ) I can set an axis label (im using it to show the last value of a price chart). But is there any way that I could have

the label appear to the right of the chart, rather than on the left? (but I want to keep the axis on the left).

Two ways I thought of if this is not possible with theHorizontalLineAnnotation
1 - TextAnnotation - this kind of works but it wont display anything to the right of the chart series as it is clipped, and seems no way to add padding to the right of the chart area?
2 - Having a second axis showing same as that on the left, but could hide the axis labels and then the annotional label could be displayed on this axis - but dont know if that is possible

Thanks for any help


1 Reply

MK Muneesh Kumar G Syncfusion Team July 19, 2019 01:57 PM UTC

Hi Tom, 
 
Greetings from Syncfusion.  
 
We have analyzed your requirement and you can achieve this by setting YAxis for with OpposedPosition as true, then set the axis name to annotation’s YAxisName, then set default axis and series yaxis Minimum and Maximum as same, finally collapse the opposed axis visibility as Hidden as per the below code snippet.  
 
Code snippet 
 
  <chart:SfChart  Margin="10"> 
 
            <chart:SfChart.SecondaryAxis> 
                <chart:NumericalAxis Minimum="0" Maximum="50"> 
                </chart:NumericalAxis> 
            </chart:SfChart.SecondaryAxis> 
 
            <chart:SfChart.Annotations> 
                <chart:HorizontalLineAnnotation Y1="12"  
                                 ShowAxisLabel="True" YAxisName="yAxis"/> 
            </chart:SfChart.Annotations> 
            <chart:LineSeries XBindingPath="XValue"  
                                Label="Series" 
                                YBindingPath="YValue" 
                             ItemsSource="{Binding Data}"> 
                <chart:LineSeries.YAxis> 
                    <chart:NumericalAxis OpposedPosition="True" 
                                         Minimum="0" Maximum="50" ShowGridLines="False" 
                                         Visibility="Hidden" 
                                         x:Name="yAxis"/> 
                </chart:LineSeries.YAxis> 
            </chart:LineSeries> 
 
        </chart:SfChart> 
 
 
Screenshot:  
 
 
Please let us know if you have any other queries.  

Regards, 
 
Muneesh Kumar G. 


Loader.
Live Chat Icon For mobile
Up arrow icon