Multiple datalabel template
Is it possible to use multiple template for datalabel.
e.g. If x < 10 then use templete 'template1' and if x>=10 then use template 'template2'
SIGN IN To post a reply.
3 Replies
BP
Baby Palanidurai
Syncfusion Team
July 5, 2019 10:20 AM UTC
Hi Sutthipong,
Greetings from Syncfusion.
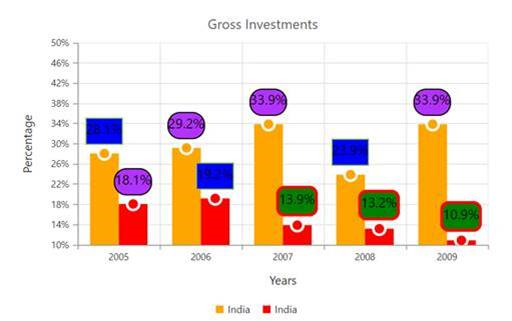
We have analysed your query. Yes, we can add multiple template for data label using seriesRendering event. Using this event we can assign marker template for each points based on provided condition. We have prepared a simple sample based on your requirement. In that multiple template is working fine as you expect. Please find below sample and code snippet,
Code Snippet:
|
seriesRendering: function(args){
for(var j=0; j < args.data.series.points.length; j++){
if(args.data.series.points[j].y > 19 && args.data.series.points[j].y < 29 ) {
args.data.series.points[j].marker = { dataLabel: { visible:true, template: 'template' }};
} else if(args.data.series.points[j].y > 9 && args.data.series.points[j].y < 18 ) {
args.data.series.points[j].marker = { dataLabel: { visible:true, template: 'template1' }};
} else {
args.data.series.points[j].marker = { dataLabel: { visible:true, template: 'template2' }};
}
}
}, |
Screenshot:
Hope this helps.
Regards,
Baby.
SU
Sutthipong
July 10, 2019 03:49 AM UTC
Sorry for late response.
It working as I expected but I have some question is it possible to custom value for datalabel like display value to absolute value or format decimal place.
BP
Baby Palanidurai
Syncfusion Team
July 11, 2019 09:27 AM UTC
Hi Sutthipong,
Thanks for the update.
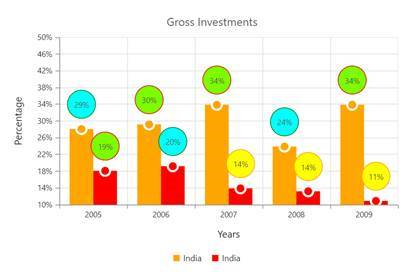
We have analyzed your query. We can achieve your requirement using the displayTextRendering event in the chart. Using this event we customize the data label text as you expect. But this is not applicable for template property. If you want to customize the text and shape for data label without using the template, then we suggest you to use datalabel fill, shape, and border properties and displayTextRendering event. In this case, we can show the formatted text as you expected format. We have attached the modified sample and screenshot. Please find below sample and screenshot,
Code Snippet:
|
//To customize the outer appearance of the datalabel
seriesRendering: function(args){
for(var j=0; j < args.data.series.points.length; j++){
if(args.data.series.points[j].y > 19 && args.data.series.points[j].y < 29 ) {
args.data.series.points[j].marker = { dataLabel: { visible:true, fill: 'aqua',border: { color: "green", width: 1}, shape: 'circle', offset: 20 }};
} else if(args.data.series.points[j].y > 9 && args.data.series.points[j].y < 18 ) {
args.data.series.points[j].marker = { dataLabel: { visible:true, fill: 'yellow',border: { color: "orange", width: 1}, shape: 'circle', offset: 20 } };
} else {
args.data.series.points[j].marker = { dataLabel: { visible:true, fill: 'lawngreen',border: { color: "red", width: 1}, shape: 'circle', offset: 20 } };
}
}
},
//To customize the text
displayTextRendering: function(args) {
args.data.text = Math.ceil(args.model.series[args.data.seriesIndex].points[args.data.pointIndex].y) + '%';
}, |
Screenshot:
Hope this helps.
Regards,
Baby.
SIGN IN To post a reply.
- 3 Replies
- 2 Participants
-
SU Sutthipong
- Jul 5, 2019 04:52 AM UTC
- Jul 11, 2019 09:27 AM UTC
