- Home
- Forum
- ASP.NET Core - EJ 2
- No Chart is being displayed, no errors
No Chart is being displayed, no errors
I'm new to syncfusion, never added any control to a asp.net core application before.
Step taken so far:
- added nuget package : syncfusion.EJ2.AspNet.Core
- added to _layout.cshtml
<head>
<link rel="stylesheet" rel='nofollow' href="https://cdn.syncfusion.com/ej2/material.css" />
<script src="https://cdn.syncfusion.com/ej2/dist/ej2.min.js"></script>
....
@RenderSection("scripts", required: false)
<ejs-scripts></ejs-scripts>
</body>
- Generated a license from the syncfusion webpage.
- Added license in startup.cs
public void Configure(IApplicationBuilder app, IHostingEnvironment env)
{
Syncfusion.Licensing.SyncfusionLicenseProvider.RegisterLicense("<mylicensekey>");
- The controller that will generate the view with the chart
ViewBag.NoShowAge = viewModel.ByAges.ToList();
The relevant columns in the model are :
PatientAge
Amount
I checked and there is actual data in it before passing the viewmodel on to the view
- The view rendering the page
<div class="col-md-12 row">
<div class="col-md-12 btn btn-light-green" style="padding: 5px">
<div class="row">
<div class="col-md-1">
<span class="fas fa-hourglass-half " style="font-size: 50px; padding: 3px;"></span>
</div>
<div class="col-md-11">
<div>
<ejs-chart id="byagechart" title="@DisplayName.Age" width="100%">
<e-chart-primaryxaxis valueType="Category" labelFormat="y" edgeLabelPlacement="Shift"></e-chart-primaryxaxis>
<e-series-collection>
<e-series dataSource="ViewBag.NoShowAge" name="PatientAge" xName="PatientAge" width="2" opacity="1" yName="Amount" type="@Syncfusion.EJ2.Charts.ChartSeriesType.Line"></e-series>
</e-series-collection>
</ejs-chart>
</div>
</div>
</div>
</div>
</div>
SIGN IN To post a reply.
5 Replies
BP
Baby Palanidurai
Syncfusion Team
July 5, 2019 09:58 AM UTC
Hi Johnny,
Greetings from Syncfusion.
We have analysed your query. We have tried to replicate the reported scenario. Unfortunately, we are unable to reproduce the reported problem at our end. From the provided code snippet, we suspect that the issue may occur, if you have missed to refer syncfusion.EJ2 tag helper in _ViewImports.cshtml page. So please ensure that at your end. We have prepared a sample using your code snippet. In that chart is working fine as you expect. Please find below code snippet and sample,
Code Snippet:
|
[_layout.cshtml]:
<ejs-scripts></ejs-scripts>
[_ViewImports.cshtml]:
@addTagHelper *, Syncfusion.EJ2
[index.cshtml]:
<div class="col-md-12 row">
<div class="col-md-12 btn btn-light-green" style="padding: 5px">
<div class="row">
<div class="col-md-1">
<span class="fas fa-hourglass-half " style="font-size: 50px; padding: 3px;"></span>
</div>
<div class="col-md-11">
<div>
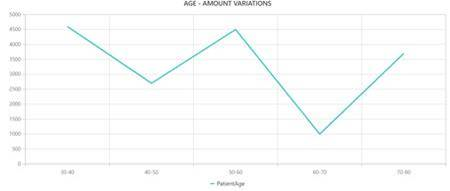
<ejs-chart id="byagechart" title="AGE - AMOUNT VARIATIONS" width="100%">
<e-chart-primaryxaxis valueType="Category" labelFormat="y" edgeLabelPlacement="Shift"></e-chart-primaryxaxis>
<e-series-collection>
<e-series dataSource="ViewBag.dataSource" name="PatientAge" xName="PatientAge" width="2" opacity="1" yName="Amount" type="@Syncfusion.EJ2.Charts.ChartSeriesType.Line"></e-series>
</e-series-collection>
</ejs-chart>
</div>
</div>
</div>
</div>
</div>
[HomeController.cs]:
public IActionResult Index()
{
List<ColumnChartData> chartData = new List<ColumnChartData>
{
new ColumnChartData { PatientAge= "30-40", Amount= 4600 },
new ColumnChartData {PatientAge= "40-50", Amount= 2700 },
new ColumnChartData { PatientAge= "50-60", Amount= 4500 },
new ColumnChartData { PatientAge= "60-70", Amount= 1000 },
new ColumnChartData { PatientAge= "70-80", Amount= 3700 },
};
ViewBag.dataSource = chartData;
return View();
}
public class ColumnChartData
{
public string PatientAge;
public double Amount;
} |
Screenshot:
Sample: https://www.syncfusion.com/downloads/support/directtrac/general/ze/chartrendering_fix1219728934.zip
Kindly check the above sample and revert us, if still you have faced any problem.
Regards,
Baby.
JO
Johnny
July 8, 2019 09:31 AM UTC
Thx for the input. I was able to make it work now.
BP
Baby Palanidurai
Syncfusion Team
July 9, 2019 06:43 AM UTC
Hi Johnny,
Most welcome. Kindly get in touch with us, if you would require further assistance. We are always happy in assisting you.
Thanks,
Baby.
SW
Savvy Witham
April 1, 2021 08:26 PM UTC
Johnny,
What were you able to do to make it work? I have the same issue - no charts displaying but no error - however mine has been working for weeks and just today it randomly stopped with no changes.
DG
Durga Gopalakrishnan
Syncfusion Team
April 2, 2021 08:35 AM UTC
Hi Savvy,
Please ensure that all dependencies have been restored and all packages have been referenced before running the sample. Exit Visual Studio and remove the bin and obj folders, then reopen your application and check. Since we are unsure of your exact cause, please send us a sample and a picture or video file, if possible, so that we can check this case.
Regards,
Durga G
SIGN IN To post a reply.
- 5 Replies
- 4 Participants
-
JO Johnny
- Jul 4, 2019 01:45 PM UTC
- Apr 2, 2021 08:35 AM UTC
