- Home
- Forum
- React - EJ 2
- Tooltip
Tooltip
Hi, I have this code: https://stackblitz.com/edit/react-stockchart-crosshair-qqh14r
I have 3 problems:
- How can I visualise a legend? Looks like legendSettings is not supported by the StockChartComponent
- If you look at the tooltip it shows lot of `null` values. How can I change it to show only my data? (Price value and data?)
- the lineStyle for the primaryYAxis is ignored
SIGN IN To post a reply.
2 Replies
BP
Baby Palanidurai
Syncfusion Team
June 20, 2019 12:34 PM UTC
Hi Marco,
Greetings from Syncfusion.
Query #1: How can I visualise a legend? Looks like legendSettings is not supported by the StockChartComponent?
We have analysed your query. As of now we don’t have support for stock chart legend. So we will provide work around sample for legend using annotation. Now we are working on this and we will update the status within one business day(June 21, 2019).
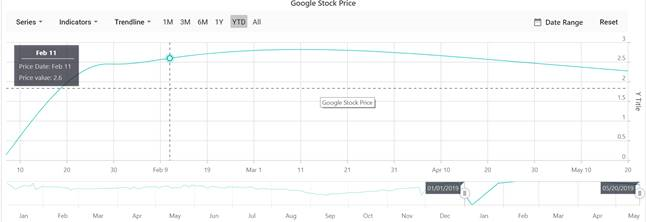
Query #2: If you look at the tooltip it shows lot of `null` values. How can I change it to show only my data? (Price value and data?)
By using tooltip format property we can customize the format based on given data. Please find below code snippet,
Code snippet:
|
tooltip={{enable: true, format: 'Price Date: ${point.x} <br/> Price value: ${point.y}'}} |
Screenshot:
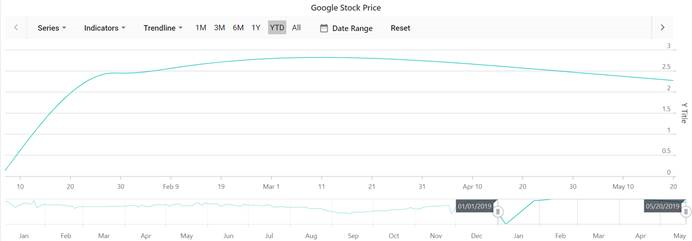
Query #3: the lineStyle for the primaryYAxis is ignored
We have analysed your query with your code snippet. From that, We suspect you want to remove gridlines of the primayXAxis. By setting majorGridLine width value as zero in primaryXAxis we can ingnore the gridline.
Code Snippet:
|
primaryXAxis={{ majorGridLines: { width: 0 }}} |
Screenshot:
Kindly revert us, if you have any concerns.
Regards,
Baby.
BP
Baby Palanidurai
Syncfusion Team
June 21, 2019 10:59 AM UTC
Hi Marco,
Thanks for your patience.
Query #1: How can I visualise a legend? Looks like legendSettings is not supported by the StockChartComponent?
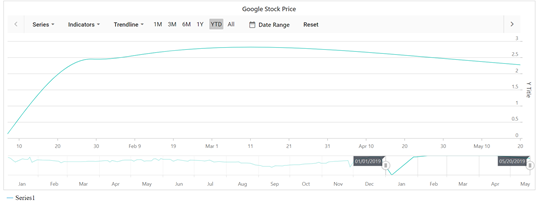
We have analysed your query. We have prepared a work around sample for legend support to stock chart component. In that we have changed the visibility of the series based on click over the legend div element. Please find below sample,
Screenshots:
|
Before Legend Click |
After Legend Click |
 |
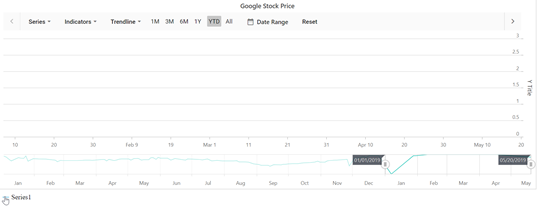 |
Kindly revert us, if you have any concerns.
Regards,
Baby.
SIGN IN To post a reply.
- 2 Replies
- 2 Participants
-
MG Marco Giorgi
- Jun 19, 2019 09:50 PM UTC
- Jun 21, 2019 10:59 AM UTC
