Export multi series chart to excel
How to export multi series chart to Excel file.
The sample that come with installation only has one serie chart export.
SIGN IN To post a reply.
11 Replies
BP
Baby Palanidurai
Syncfusion Team
June 19, 2019 10:40 AM UTC
Hi Sutthipong,
Greetings from Syncfusion.
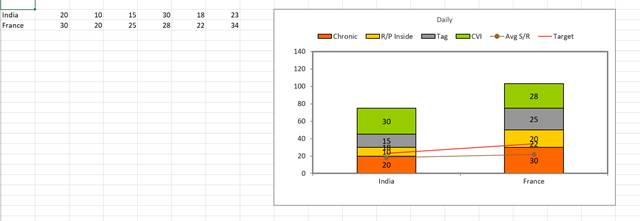
We have analyzed your query. We would like to let you know that the multi series chart export process same as like single series chart export. We have prepared a sample based on your requirement. In that we have used three series in the chart and export into excel type. Please find below sample and screenshot,
Screenshot:

Hope this helps.
Regards,
Baby.
SU
Sutthipong
June 21, 2019 08:47 AM UTC
Sorry for late response.
If my server is not online must I implement server-side code?
If so what is the code for server-side function for https://js.syncfusion.com/demos/ejServices/api/Chart/ExcelExport
BP
Baby Palanidurai
Syncfusion Team
June 24, 2019 10:09 AM UTC
Hi Sutthipong,
Thanks for the update.
We have analyzed your query. We have attached server side code for ExcelExport method. Please find below code snippet,
Code Snippet:
ChartFeatures.cshtml:
|
<button onclick="download()" value="Export">Export</button>
<div id="ControlRegion">
@(Html.EJ().Chart("container").ExportSettings(ex => ex.Type(ChartExportingType.XLSX).Action("ExportChart")
.Mode(ChartExportingMode.Server))
</div>
<script>
function download(args) {
$("#container").ejChart("export");
}
</script> |
ChartController.cs
|
//Export chart method in server side
public void ExportChart(string Data, string ChartModel)
{
ChartProperties obj = ConvertChartObject(ChartModel);
string type = obj.ExportSettings.Type.ToString().ToLower();
string fileName = obj.ExportSettings.FileName;
string orientation = obj.ExportSettings.Orientation.ToString();
ExcelExport exp = new ExcelExport();
exp.Export(obj, "", fileName + ".xlsx", ExcelVersion.Excel2010, null, null);
}
private ChartProperties ConvertChartObject(string ChartModel)
{
JavaScriptSerializer serializer = new JavaScriptSerializer();
IEnumerable div = (IEnumerable)serializer.Deserialize(ChartModel, typeof(IEnumerable));
ChartProperties chartProp = new ChartProperties();
foreach (KeyValuePair<string, object> ds in div)
{
var property = chartProp.GetType().GetProperty(ds.Key, BindingFlags.Instance | BindingFlags.Public | BindingFlags.IgnoreCase);
if (property != null)
{
Type type = property.PropertyType;
string serialize = serializer.Serialize(ds.Value);
object value = serializer.Deserialize(serialize, type);
property.SetValue(chartProp, value, null);
}
}
return chartProp;
} |
Also here we have attached sample for your reference,
Hope this helps.
Regards,
Baby.
SU
Sutthipong
June 24, 2019 10:24 AM UTC
I getting System.InvalidOperationException at ConvertChartObject method
Attachment: chartmodel_6099219e.zip
object value = serializer.Deserialize(serialize, type);
The exception message is Cannot convert object of type 'System.Boolean' to type 'Syncfusion.JavaScript.DataVisualization.Models.ConnectorLineStyle'
I attached the ChartModel that posted from export function
Attachment: chartmodel_6099219e.zip
KC
Kalaimathi Chellaiah
Syncfusion Team
June 26, 2019 03:36 AM UTC
Hi Sutthipong,
Thanks for the update.
We have analyzed your query. As of now, we can export SVG and canvas elements only. The tooltip, crosshair, connector lines and some other custom styles are created by html dev element, so we are unable export these elements. That’s why the exception is occurred. So we suspect if you are used connector line property in your sample then the reported issue has occurred when converting the chart model properties. Please revert if you need any other customization (or) further assistance.
Kindly revert us, if you have any queries.
Regards,
Kalai.
SU
Sutthipong
June 26, 2019 05:12 AM UTC
In my graph setting I do not use lineconnector this is my code
$("#daychart").ejChart({
primaryYAxis: {
majorGridLines: { visible: false },
font: {
color:'black',
fontWeight:'bold',
size:'12px'
}
},
primaryXAxis: {
labelBorder: { width: 1 },
range: { interval: 1 },
crossesAt: 0,
showNextToAxisLine: false,
majorGridLines: { visible: false },
font: {
color:'black',
fontWeight:'bold',
size:'12px'
}
},
series: [
{
name: 'Chronic',
points: [],
fill: 'url(#chronicPattern)',
type: 'stackingColumn',
border: { color: "black", width: 1 },
marker: {
dataLabel: {
//Set text alignment to datalabel text
visible: true,
horizontalTextAlignment: "center",
font: {
fontWeight:'bold'
},
textPosition : "middle"
},
border: {
width: 0
},
visible: false
},
tooltip:
{
visible: true
}
},
{
name: 'R/P Inside',
points: [],
fill: 'url(#rpiPattern)',
type: 'stackingColumn',
border: { color: "black", width: 1 },
marker: {
dataLabel: {
//Set text alignment to datalabel text
visible: true,
horizontalTextAlignment: "center",
font: {
fontWeight:'bold'
},
textPosition : "middle"
},
border: {
width: 0
},
visible: false
}
},
{
name: 'Tag',
points: [],
fill: 'url(#tagPattern)',
type: 'stackingColumn',
border: { color: "black", width: 1 },
marker: {
dataLabel: {
//Set text alignment to datalabel text
visible: true,
horizontalTextAlignment: "center",
font: {
fontWeight:'bold'
},
textPosition : "middle"
},
border: {
width: 0
},
visible: false
},
tooltip:
{
visible: true
}
},
{
name: 'CVI',
points: [],
fill: 'url(#cviPattern)',
type: 'stackingColumn',
border: { color: "black", width: 1 },
marker: {
dataLabel: {
//Set text alignment to datalabel text
visible: true,
horizontalTextAlignment: "center",
font: {
fontWeight:'bold'
},
textPosition : "middle"
},
border: {
width: 0
},
visible: false
},
tooltip:
{
visible: true
}
},
{
name: 'Avg S/R',
points: [],
fill: "#996633",
type: 'line',
marker: {
dataLabel: {
//Set text alignment to datalabel text
visible: true,
horizontalTextAlignment: "center",
font: {
fontWeight:'bold'
}
},
border: {
width: 0
},
visible: true
}
},
{
name: 'Target',
points: [],
fill: "red",
dashArray: '5,5',
type: 'line',
},
],
commonSeriesOptions:
{
//To avoid overlap labels
enableSmartLabels: true,
},
legend: {
// ...
//Place the legend at top of the chart
alignment: 'far',
position: 'top',
},
title:
{
text: 'Daily',
position: "top",
textAlignment: "near",
maximumWidth: 150
},
axesRangeCalculate: function (sender) {
if (sender.data.axis.orientation == "vertical")
sender.data.range.max += sender.data.range.interval;
}
});
and this is my svg pattern fill
<svg width="400" height="110">
<pattern id="chronicPattern" patternUnits="userSpaceOnUse" width="4" height="4">
<rect x="0" y="0" width="100%" height="100%" fill="yellow" />
<path d="M-1,1 l2,-2
M0,4 l4,-4
M3,5 l2,-2"
style="stroke:#cccccc; stroke-width:1" />
</pattern>
<pattern id="rpiPattern" patternUnits="userSpaceOnUse" width='8' height='8' viewBox='0 0 8 8'>
<rect x="0" y="0" width="100%" height="100%" fill="blue" />
<path fill-rule='evenodd' d='M0 0h4v4H0V0zm4 4h4v4H4V4z'
style="stroke:#cccccc; stroke-width:1" fill-opacity='0.4' />
</pattern>
<pattern id="tagPattern" patternUnits="userSpaceOnUse" width='40' height='1' viewBox='0 0 40 1'>
<rect x="0" y="0" width="100%" height="100%" fill="green" />
<path d='M0 0h20v1H0z' fill='#cccccc' fill-opacity='0.4' fill-rule='evenodd' />
</pattern>
<pattern id="cviPattern" patternUnits="userSpaceOnUse" width='20' height='20' viewBox='0 0 20 20'>
<rect x="0" y="0" width="100%" height="100%" fill="#ff9900" />
<g fill='#cccccc' fill-opacity='0.54' fill-rule='evenodd'>
<circle cx='3' cy='3' r='3' />
<circle cx='13' cy='13' r='3' />
</g>
</pattern>
</svg>
What am I need to remove to be able to export.
KC
Kalaimathi Chellaiah
Syncfusion Team
June 26, 2019 05:54 PM UTC
Hi Sutthipong,
Thanks for the update.
We have analyzed your query with the provided code snippet. From that, we found that issue occurred from the enableSmartLabels property. When we set enableSmartLabels property value as true, then the connector line automatically created if the data label is overlapped with another label. That’s why the reported problem has occurred. So we suggest setting enablesmartlabels property value as false. Also, we would like to let you know that the export method does not accept pattern format (fill:'url(#cviPattern)') fill colors of the chart series. We have prepared a sample using your code snippet. We have done mentioned changes in below sample and export is working fine at our end.
Screenshot:
Kindly check the above sample and revert us if still you have faced any problems.
Regards,
Kalai.
SU
Sutthipong
June 28, 2019 03:55 AM UTC
But my client requirement is the series must be pattern fill. Is there a workaround for this.
KC
Kalaimathi Chellaiah
Syncfusion Team
July 2, 2019 09:19 AM UTC
Hi Sutthipong,
Thanks for being patience.
We have analyzed your query. There is no possibility to achieve your requirement in work around. Because when we export the chart all color which present in the chart properties will be converted into HTML color. In your case the color string is the id of the pattern, so we unable to convert the id in HTML color. That’s why the exception has occurred.
Kindly revert us, if you have any concerns (or) further assistance.
Regards,
Kalai.
SU
Sutthipong
July 5, 2019 04:58 AM UTC
Never mind then.
My client not restricted me to export to excel so I export to other format with help of other library. It not perfect but acceptable.
BP
Baby Palanidurai
Syncfusion Team
July 8, 2019 07:25 AM UTC
Hi Sutthipong,
Thanks for the update. Kindly get in touch with us, if you would require further assistance. We are always happy in assisting you.
Thanks,
Baby.
SIGN IN To post a reply.
- 11 Replies
- 3 Participants
-
SU Sutthipong
- Jun 19, 2019 04:24 AM UTC
- Jul 8, 2019 07:25 AM UTC
