- Home
- Forum
- ASP.NET Web Forms
- Populating pivot chart using WebAPI
Populating pivot chart using WebAPI
Hi,
I am trying to populate a pivot chart using a Relational WebAPI class. However, when I initialize the chart, I receive a 404 error on the "InitializeChart" action name.
Also, is it possible to populate a pivot chart in the code behind?
Thanks!
SIGN IN To post a reply.
9 Replies
SA
Scintilla Arul Jothi Raj
Syncfusion Team
June 12, 2019 01:36 PM UTC
Hi Matt,
Thanks for contacting Syncfusion support. Please find the response below.
We have analyzed your query and suspect that the URL for WebAPI controller is not given properly. Meanwhile, we have prepared a sample with the below link.
Sample link: http://www.syncfusion.com/downloads/support/forum/145188/ze/SyncfusionASPNETApplication41753205129
Documentation Link: https://help.syncfusion.com/aspnet/pivotchart/relational-getting-started#creating-a-simple-application-with-pivot-chart-and-relational-data-sources-server-mode
Screenshot:

Kindly let us know if you have any concerns.
Regards,
Scintilla A
MB
Matt Broich
June 12, 2019 03:02 PM UTC
This solved my problem. It turns out that my API route was incorrect.
Thank you!
JP
Jagadeesan Pichaimuthu
Syncfusion Team
June 13, 2019 11:19 AM UTC
Hi Matt,
Thanks for the update.
We are glad to know that the reported problem has been resolved at your end. Please let us know if you have any further queries on this. We are happy to help you.
Regards,
Jagadeesan
MB
Matt Broich
June 13, 2019 05:21 PM UTC
Hello again,
I do have one more question; is it possible to set the DataSource dynamically through a drop-down-list?
For example, the pivot chart I am making will display items based on the fields "Today", "This Week", "This Month", or "This Year". If the user selects "Today" it should populate the chart with all entries from today (I already have the SQL for this). How would I update/refresh the chart after a selection is made if all of my code dictating the chart lies in a separate WebAPI file?
Thank you!
JP
Jagadeesan Pichaimuthu
Syncfusion Team
June 14, 2019 08:59 AM UTC
Hi Matt,
Thanks for the update and please find the response below.
You can change the PivotChart data source using “customObject” property. Please find the code snippets below.
Code Snippet: [ASPX] (Dropdown list options)
|
<asp:Content ID="Content1" runat="server"ContentPlaceHolderID="PropertySection">
<div id="sampleProperties">
<div class="prop-grid">
<div class="row">
<div class="col-md-3" style="width: 75px; padding-top: 3px;margin-top: 18px">
DataSource
</div>
<div class="col-md-3" style="margin-top: 17px">
<select id="dataSourceType">
<option value="today">Today</option>
<option value="thisWeek">This Week</option>
<option value="thisMonth">This Month</option>
<option value="thisyear">This Year</option>
</select>
</div>
</div>
</div>
</div>
</asp:Content> |
Code Snippet: [JavaScript] (Refresh PivotChart with “cutomObject” property)
|
<asp:Content ID="ScriptContent" runat="server"ContentPlaceHolderID="ScriptSection">
<script>
$(function () {
$("#sampleProperties").ejPropertiesPanel();
$("#dataSourceType").ejDropDownList({
width: "110px"
}); //Dropdownlist widget
$("#dataSourceType").ejDropDownList("option", "change","DataSourceChanged"); //Event for dropdownlist changes
});
function DataSourceChanged(args) {
var ddlvalue = args.value.toLowerCase();
$(".e-pivotchart").remove();
var chartPanel = ej.buildTag("div#PivotChart1", "", {})[0].outerHTML;
$(chartPanel).appendTo("#ControlRegion")
$("#PivotChart1").ejPivotChart({
url: "../api/RelationalChart",
type: ej.PivotChart.ChartTypes.Column,
customObject:ddlvalue, //Refresh PivotChart with custom object value
commonSeriesOptions: {
enableAnimation: true,
type: ej.PivotChart.ChartTypes.Column, tooltip: { visible: true }
},
size: { height: "460px", width: "100%" }, legend: { visible: true },
load: "loadTheme"
});
}
</script>
</asp:Content> |
Code Snippet: [C#] (Customize datasource )
|
[System.Web.Http.ActionName("InitializeChart")]
[System.Web.Http.HttpPost]
public Dictionary<string, object> InitializeChart(Dictionary<string, object> jsonResult)
{
string customData = null;
if (jsonResult["customObject"].ToString() == "{}")
customData = jsonResult["customObject"].ToString();
else
customData = serializer.Deserialize<dynamic>(jsonResult["customObject"].ToString());
this.BindData(customData); // Pass the dropdownlist value here (custom object)
return PivotChart.GetJsonData(jsonResult["action"].ToString(), ProductSales.GetSalesData());
}
private void BindData(string dataSourceValue) //You can customize the datasource as per your requirement
{
if(dataSourceValue == "today")
this.PivotChart.PivotEngine.PivotRows.Add(new PivotItem { FieldMappingName ="Country", FieldHeader = "Country", TotalHeader = "Total", ShowSubTotal = false});
else if (dataSourceValue == "thisweek")
this.PivotChart.PivotEngine.PivotRows.Add(new PivotItem { FieldMappingName ="State", FieldHeader = "State", TotalHeader = "Total" });
else if (dataSourceValue == "thismonth")
this.PivotChart.PivotEngine.PivotRows.Add(new PivotItem { FieldMappingName ="Date", FieldHeader = "Date", TotalHeader = "Total" });
else if (dataSourceValue == "thisyear")
this.PivotChart.PivotEngine.PivotRows.Add(new PivotItem { FieldMappingName ="Quantity", FieldHeader = "Quantity", TotalHeader = "Total" });
else
this.PivotChart.PivotEngine.PivotRows.Add(new PivotItem { FieldMappingName ="State", FieldHeader = "State", TotalHeader = "Total" });
this.PivotChart.PivotEngine.PivotColumns.Add(new PivotItem { FieldMappingName = "Product", FieldHeader = "Product", TotalHeader = "Total", ShowSubTotal =false });
this.PivotChart.PivotEngine.PivotCalculations.Add(new PivotComputationInfo { CalculationName = "Amount", Description = "Amount", FieldHeader = "Amount", FieldName = "Amount", Format = "C", SummaryType = Syncfusion.PivotAnalysis.Base.SummaryType.DoubleTotalSum });
} |
Meanwhile, we have prepared a sample for your convenience.
Sample Link: http://www.syncfusion.com/downloads/support/forum/145188/ze/SyncfusionASPNETApplication41985811372
Screenshot: (for “Today”)

Screenshot: (for “This Week”)

Please let us know if you have any concerns.
Regards,
Jagadeesan
MB
Matt Broich
June 18, 2019 09:28 PM UTC
With a few tweaks, I got it to work. Thank you.
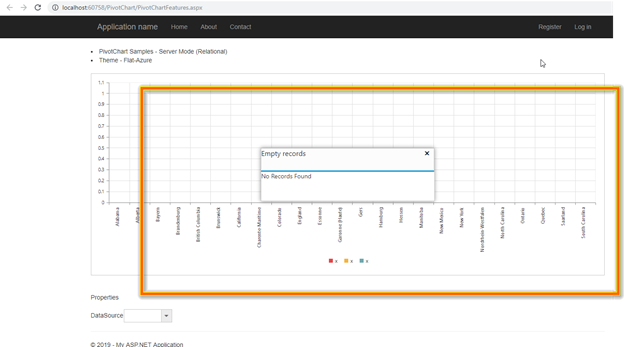
One final question for this thread - how should I go about displaying "No records found" if the data returned to the client is null/empty? The way I am populating the pivot chart makes it so it always has some form of data, even if the data is just the row/column name.
Thank you for all the help!
DB
Dinesh Babu Yadav
Syncfusion Team
June 19, 2019 02:20 PM UTC
Hi Matt,
Thanks for the update.
We have understood that when you have no fields in the “Values” (PivotCalculation) axis, the dialog should be displayed on PivotChart as “No records found”. You can done your requirement through “RenderSuccess” event of PivotChart as a work around solution. Please find the code snippet below.
Code Snippet: [ASPX] (Trigger “RenderSuccess” event in PivotChart)
|
<ej:PivotChart ID="PivotChart1" runat="server" Locale="en-US" Url="../api/RelationalChart" IsResponsive="true" ClientIDMode="Static">
<CommonSeriesOptions Type="Column" EnableAnimation="True" Tooltip-Visible="true"/>
<ClientSideEvents Load="loadTheme" RenderSuccess="renderSuccess"/>
<Size Width="100%" Height="460px"></Size>
</ej:PivotChart> |
Code Snippet: [JavaScript] (Create dialog in the “renderSuccess” method)
|
function renderSuccess(args) {
if (!ej.isNullOrUndefined(args.getOlapReport()) && JSON.parse(args.getOlapReport()).values == "[]") //Check empty values here. You can get rows and columns information through the following codes respectively. JSON.parse(args.getOlapReport()).rows, JSON.parse(args.getOlapReport()).columns
{
$(".e-dialog, .e-clientDialog, .e-tableDlg").remove();
var dialogContent = ej.buildTag("div#" + this._id + "_tableDlg.e-tableDlg","No Records Found")[0].outerHTML;
var ejDialog = ej.buildTag("div#clientDialog.e-clientDialog", dialogContent, { "opacity": "1" }).attr("title", "Empty records")[0].outerHTML;
$(ejDialog).appendTo("#PivotChart1");
args.element.find(".e-clientDialog").ejDialog({ width: "25%", content: "#" + args._id, enableResize: false, close: ej.proxy(ej.Pivot.closePreventPanel, this) });
}
}
function DataSourceChanged(args) {
$("#PivotChart1").ejPivotChart({
//….
load: "loadTheme",
renderSuccess:"renderSuccess" // Trigger event here also
});
} |
Meanwhile, we have shared the controller and html file in the following link. Kindly replace and check with the project which we have shared already.
Controller and html file link: http://www.syncfusion.com/downloads/support/forum/145188/ze/controller_aspx-1905371113
Screenshot:
If this doesn’t match your requirement please get back to us which will help us to provide you the better solution.
Regards,
Dinesh Babu Yadav
MB
Matt Broich
June 19, 2019 03:37 PM UTC
Perfect, thank you for the quick reply. Everything is working now, thank you for all the help!
DB
Dinesh Babu Yadav
Syncfusion Team
June 20, 2019 03:58 AM UTC
Hi Matt,
Thanks for the update. Please get back to us if you need further other assistance from us.
Regards,
Dinesh Babu Yadav
SIGN IN To post a reply.
- 9 Replies
- 4 Participants
-
MB Matt Broich
- Jun 11, 2019 09:03 PM UTC
- Jun 20, 2019 03:58 AM UTC
