We use cookies to give you the best experience on our website. If you continue to browse, then you agree to our privacy policy and cookie policy. Image for the cookie policy date
close icon

GridControl range to fill Chart

Hi,

I am currently looking into the best way to replicate some of the functions of excel with an emphasis on visualizing data in charts. I have found that the Spreadsheet control has some great potential but is also buggy and has a fairly weak charting system that simply doesn't compare to the standalone chartcontrol (which I love). I have written about some of the spreadsheet control's issues on the forum.

As an alternative I am experimenting with the ExcelLikeUI sample and the ability to add chartcontrols into gridcontrol cells. This concept seems to create a stronger excel-like solution. However, I have a couple of questions about this marriage of gridcontrol and chartcontrol and I am hoping you can help.

1) I would like to link a selected range of cells to a selected, embedded chartcontrol to be its data source, much like Excel charts, so that when data changes in the gridcontrol range it would automatically update the chartcontrol. I have seen a couple of forum entries asking about this idea, but they were quite old and did not have a solution at the time. At this point, is there a good method to link gridcontrol range data to a chartcontrol?

2) embedding chartcontrols into cells and then merging cells to edit the size of the charts works, but is there a good and simple way to be able to drag the charts to move them as well as resize them?

Thanks!

19 Replies

JP Jagadeesan Pichaimuthu Syncfusion Team June 3, 2019 11:36 AM UTC

Hi Travis, 
  
Thanks for using Syncfusion product. 
  
Query 
Response 
 I would like to link a selected range of cells to a selected, embedded chartcontrol to be its data source, much like Excel charts, so that when data changes in the gridcontrol range it would automatically update the chartcontrol. I have seen a couple of forum entries asking about this idea, but they were quite old and did not have a solution at the time. At this point, is there a good method to link gridcontrol range data to a chartcontrol? 
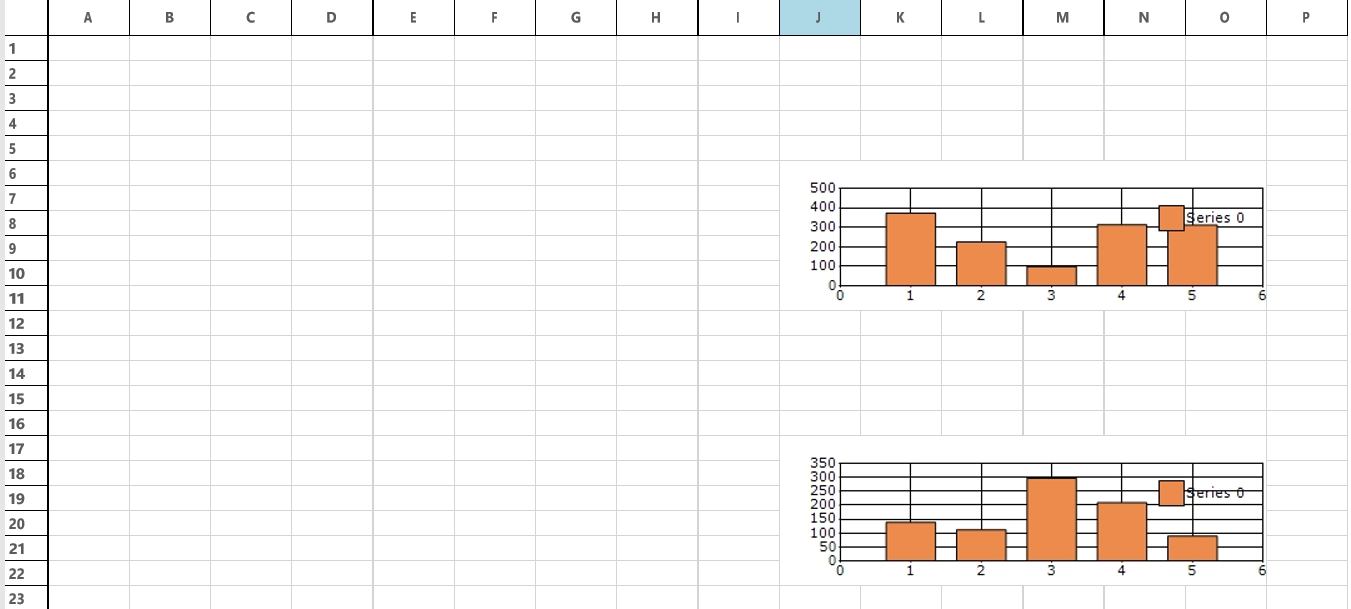
GridControl does have the support to render the chart control based on the Gridcell value. Please refer the following dashboard sample. 
  
embedding chartcontrols into cells and then merging cells to edit the size of the charts works, but is there a good and simple way to be able to drag the charts to move them as well as resize them? 
To load the chart control for grid cells, you could use the Control cell type and use the Control property. Please refer the following code example 
  
C# 
ChartControl chart = new ChartControl(); 
hart.Dock = DockStyle.Fill; 
this.gridControl1[2, 3].CellType = GridCellTypeName.Control; 
this.gridControl1[2, 3].Control = chart; 
  
Once you have loaded the chart control inside of the cell, you could not resize the chart directly but you can resize the cell to increase the chart height/width. 
  
Please get back to us if you need any further assistance on this. 
  
Regards, 
Jagadeesan 


TC Travis Chambers June 3, 2019 04:15 PM UTC

Thank you so much for this feedback! I got the data working, however it only works for the values. Is there a way to include the row and column headers in the cell range so that the c axis labels reflect the row headers and the series names reflect the column headers?

Thanks!


TC Travis Chambers June 3, 2019 04:33 PM UTC

In addition to the charts, I like the idea of using gridcontrol as a workbook. 

Is it possible to reference ranges from another sheet in a formula (I.e. reference range in sheet 1 in a formula in sheet2). 

And is it possible to define named ranges for use in formulas (give a name to a column of data)

Thanks!


JP Jagadeesan Pichaimuthu Syncfusion Team June 4, 2019 11:55 AM UTC

Hi Travis, 
  
Thanks for your update. 
  
Query 
Response 
is there a way to include the row and column headers in the cell range so that the c axis labels reflect the row headers and the series names reflect the column headers? 
If you want to use the header title for chart, you could use the 0th index to get the value. 
  
Example 
To get the column header, 
string colHeader = this.Grid[0, this.cellvalueGridRangeInfo.Left].Text; 
  
To get the row header value, 
string rowHeader =this.Grid[this.cellvalueGridRangeInfo.Top, 0].Text; 
In addition to the charts, I like the idea of using gridcontrol as a workbook.  
  
Is it possible to reference ranges from another sheet in a formula (I.e. reference range in sheet 1 in a formula in sheet2).  
  
And is it possible to define named ranges for use in formulas (give a name to a column of data) 
  
To refer the GridControl cell reference in another GridControl like as workbook, you could register that grid using GridFromulaEngine.RegisterGridAsSheet method and use the FormulaCell celltype for grid cells. Please refer the following code example and dashboard sample, 
  
C# 
GridFormulaEngine.RegisterGridAsSheet("gridControl1",this.gridControl1.Model, 0); 
this.gridControl1.TableStyle.CellType =GridCellTypeName.FormulaCell; 
  
  
Please get back to us if you need any further assistance on this. 
  
Regards, 
Jagadeesan


TC Travis Chambers June 4, 2019 12:52 PM UTC

Hi,

Thank you for response! I have a couple of other questions.

1) is it possible to save embedded charts along with saving the workbook?

2) is it possible to export the workbook to pdf including the embedded charts ?

3) serializing a chart control does not serialize all chart properties. I have asked about this before but it has been a long time. Are there plans to allow serializing all available properties, such as custom xaccess labels and symbol (marker) properties?


AR Arulpriya Ramalingam Syncfusion Team June 5, 2019 02:38 PM UTC

Hi Travis, 
 
Thanks for the update. 
 
1) is it possible to save embedded charts along with saving the workbook? 
The GridControl does not has the support to export the cells with CellType as Control. However, your requirement can be achieved by converting the chart into image in a temp cell with CellType as Image. Please refer to the below UG to convert the chart into image, 
 

Note 
The imported chart as image can not be edited in the workbook. 
 
2) is it possible to export the workbook to pdf including the embedded charts ? 
By default, the page content will be converted as image to export as pdf. So, the exported chart image can be exported to pdf by using the ExcelToPdfConverter. We already documented a knowledge base to convert the excel to pdf and please refer to the below KB link for further details, 
 
3) serializing a chart control does not serialize all chart properties. I have asked about this before but it has been a long time. Are there plans to allow serializing all available properties, such as custom xaccess labels and symbol (marker) properties? 
We have forwarded you query to corresponding development team to validate further on this requirement. So, we will update the details on 10th June 2019. 
 
Regards, 
Arulpriya


TC Travis Chambers June 6, 2019 03:10 AM UTC

Thanks for your feedback! The pdf conversion is especially useful since the charts automatically convert to image along with the grid. However, while the grid info (font, etc) looks great when converted the charts seem to lose a great deal of visual quality, especially with the font of the labels. Is there any way to up the visual quality of the charts when exporting to pdf?


JP Jagadeesan Pichaimuthu Syncfusion Team June 6, 2019 11:14 AM UTC

Hi Travis, 
  
Thanks for the update. 
  
We already provided a knowledge base document to improve the clarity of the chart while exporting it to pdf. Please refer to the below KB link for further details, 
  
  
Regards, 
Jagadeesan 


TC Travis Chambers June 6, 2019 11:34 AM UTC

What if I am not using xlsio?

I am simply trying to convert the gridcontrol (with chartcontrol embedded) to pdf on demand by using GridPDFConverter. This automatically includes the embedded chartcontrols as images, but does not appear to provide a scaling option.


TC Travis Chambers June 7, 2019 04:29 AM UTC

I have discovered that I have two ways I could go about this but I have a deal breaking issue with both.

I can embed the charts in a cell (merged range) as discussed above. This works quite well except for the poor image quality of the charts when converting them to pdf.

I can also host the chartcontrols directly as a child of the gridcontrol and then convert to a pdf doc by drawing the grid and all chartcontrols to graphics. This works beautifully as the charts are perfectly rendered. It is also great being able to drag the charts around the grid like Excel, however, when you scroll the grid so that the charcontrols are out of view they disappear.

Do you have any suggestions for the best way to be able to use the chartcontrols on the gridcontrol but also producing high quality pdfs?


MG Mohanraj Gunasekaran Syncfusion Team June 7, 2019 02:01 PM UTC

Hi Travis, 
 
Thanks for the update. 
 
We tried to meet your exact use case by adding a chart into a cell to export to pdf. However, we could not meet the exact use case while converting to pdf. Also, we suspect that the issue might be occurred due some customization of the grid or chart. So, we request you to provide us the code customization that causes the issue at your end. That will be helpful for us to assist you further. 
 
Regards, 
Mohanraj G 


TC Travis Chambers June 7, 2019 02:43 PM UTC

I am doing all of my testing in the Syncfusion "ExcelLikeUI" Sample. The 2 different methods of adding charts that I have tried are as follows:

1) Embedding chart in cell

ChartControl myChartControl = new ChartControl();

this.workBook._grid[this.workBook._grid.CurrentCell.RowIndex, this.workBook._grid.CurrentCell.ColIndex].CellType = "Control"; this.workBook._grid[this.workBook._grid.CurrentCell.RowIndex, this.workBook._grid.CurrentCell.ColIndex].Control = myChartControl; this.workBook._grid.Controls.Add(myChartControl);                           

myChartControl.Font = new Font("Calibri", 8F, FontStyle.Regular, GraphicsUnit.Point);

this.workBook._grid.CoveredRanges.Add(GridRangeInfo.Cells(this.workBook._grid.CurrentCell.RowIndex, this.workBook._grid.CurrentCell.ColIndex, this.workBook._grid.CurrentCell.RowIndex + 5, this.workBook._grid.CurrentCell.ColIndex + 5));


2) Hosting chartcontrol as child of grid:

ChartControl myChartControl = new ChartControl();


myChartControl.Parent = this.workBook._grid;


myChartControl.BringToFront();


* This is the preferred experience because I can then add logic to allow dragging and resizing with the mouse, but gets messed up when scrolling the grid.


The 2 PDF conversion methods I have tried are:


1) Simply exporting the GridControl using the gridconverter when the charts are embedded:

string exeDir = System.IO.Path.GetDirectoryName(System.Reflection.Assembly.GetExecutingAssembly().Location);


GridPDFConverter pdfConverter = new GridPDFConverter();


PdfDocument Pdoc = new PdfDocument();


Pdoc.PageSettings.Orientation = PdfPageOrientation.Landscape;


string pdf = exeDir + "\\" + toolStripComboBox1.Text + ".pdf";


pdfConverter.ExportToPdf(Pdoc, this.workBook._grid, GridRangeInfo.Cells(1, 1, 39, 16));


Pdoc.Save(pdf);


*This produces the grid with the charts as images and they are very low quality.


2) Drawing the grid and charts to Graphics and then "printing" to pdf document. This works great when chartcontrols are simply children of the grid:


System.Drawing.Printing.PrintDocument pd = new System.Drawing.Printing.PrintDocument();


pd.PrintPage += new PrintPageEventHandler(pd_PrintPage) 


pd.DefaultPageSettings.Landscape = true;


pd.PrinterSettings.DefaultPageSettings.Margins.Left = 25;


pd.PrinterSettings.DefaultPageSettings.PrinterResolution.Kind = PrinterResolutionKind.High;


pd.PrinterSettings.PrinterName = "Microsoft Print to PDF";


pd.PrinterSettings.PrintToFile = true;


string exeDir = System.IO.Path.GetDirectoryName(System.Reflection.Assembly.GetExecutingAssembly().Location);


pd.PrinterSettings.PrintFileName = Path.Combine(exeDir + \\Test.pdf);


pd.Print();


private void pd_PrintPage(object sender, PrintPageEventArgs ev)


{


GraphicsState transState = ev.Graphics.Save();

//Drawing Grid

System.Drawing.Rectangle myRec = new System.Drawing.Rectangle(this.workBook._grid.Location.X, this.workBook._grid.Location.Y, this.workBook._grid.Width, this.workBook._grid.RowCount * this.workBook._grid.DefaultRowHeight);


this.workBook._grid.DrawGrid(ev.Graphics, myRec, true);

//Drawing each chart (chartListGrid1 is a separate grid that keeps a list of all charts added to the grid)

for (int i = 1; i <= chartListGrid1.RowCount; i++)

{


Control[] controlsD = this.Controls.Find(chartListGrid1[i, 1].Text, true);


ChartControl chart = controlsD[0] as ChartControl;


System.Drawing.Rectangle myRec2 = new System.Drawing.Rectangle(chart.Location.X, chart.Location.Y, chart.Width, chart.Height);

chart.Draw(ev.Graphics, myRec2);


ev.Graphics.Restore(transState);


ev.Graphics.ResetTransform();


ev.Graphics.ResetClip();


}

}


*This method renders the chartcontrols beautifully and would be great for children charts if the scroll issue could be solved.

Interesting, using this method when charts are embedded in cells does improve the image quality some but still not to an exceptable level.

I thought about using this method with the embedded charts in cells by drawing the chartcontrols on top of the chart images but I realized the actual chartcontrols do not match the size and location of the embedded chart images when in a merged cell range. If it is possible to detect the size and location of the chart images and then apply those sizes and location to each chart then that may be possible. Is it possible to detect the size and location of the Merged Cell Range that each chart is in?


Any ideas on how to solve the image quality or scrolling issue will be greatly appreciated! Thanks for your help, you guys are awesome!


TC Travis Chambers June 10, 2019 02:42 AM UTC

UPDATE:

Hi, I have actually figured out how to maintain high visual quality when using the graphics method on the embedded chartcontrols (in merged cells). Apparently, when the chartcontrols are not in the active cell they become pictures that are then skewed and made into low quality images when drawing to graphics. However, when the cells that house chartcontrols are active they revert back to actual chartcontrols. So, by looping through each chart and setting its assigned cell to active before drawing it to graphics allows it to draw the actual chartcontrol and not the image of the chart. So that's awesome!

I do have a couple of additional questions though:

1) as you saw in my code I am using kind of a hacky way to draw the controls directly to graphics and then the graphics directly to the pdf document using the Microsoft Print to PDF driver. This works great if that driver is installed on the machine, but causes problems when it isn't installed. Is it possible to draw the grid and chartcontrols directly to graphics in a syncfusion pdf doc like I can a printDocument? After looking at Syncfusions PDFDocument documentation I did not see any way to directly draw the controls to PDFgraphics, but I wanted to ask this just to be sure. I know that I can draw an image to the PDFdoc but I want to avoid that because I will then be right back where I was dealing with image skewing and poor quality.

2) After testing formulas in the gridcontrol as a workbook I noticed that referencing an entire column in a formula (i.e. A:A) does not work like it does in Excel. Is gives a "bad index" error. Is there a way around this?

Thanks!


MG Mohanraj Gunasekaran Syncfusion Team June 10, 2019 01:20 PM UTC

Hi Travis, 

Thanks for your update. 

Currently, we are working on your reported scenario. We need some more time to check this issue. So, we will check and update the details on 12th June 2019. 

Regards, 
Mohanraj G 


TC Travis Chambers June 14, 2019 01:19 PM UTC

Hi, I just wanted to check in to see if there is an update on this yet, particularly on the issue of drawing controls to graphics and then directly to pdfdocument?

Thanks! 


MG Mohanraj Gunasekaran Syncfusion Team June 17, 2019 02:39 PM UTC

Hi Travis, 

Sorry for the delay. 

We have prepared the sample based on your customization to export as a pdf and print the grid by converting the grid as a image and then tried to print the image.  so please refer the following attached sample and let us know if we misunderstand or missed anything from your customization. It will be helpful for us to provide the solution at the earliest. 


Regards, 
Mohanraj G 


TC Travis Chambers June 21, 2019 01:47 PM UTC

Thanks for your feedback. This is not quite what I was looking for though.

What I want to avoid is:

  • Using the Microsoft Print to PDF driver because not all computers have it installed
  • Exporting the grid as an image because the embedded chartcontrols don't look very good because they are skewed images as the actual gridcontrol is a different size than the converted images.

What I was hoping for is the ability to draw the grid as well as each chartcontrol to graphics (by looping through them and using their built-in drawing features) like I am doing in my Pd_PrintPage event but instead of drawing those controls directly to a PrintDocument I would like to be able to draw them directly to a Syncfusion PdfDocument if possible. Drawing them directly to graphics allows for the highest possible resolution because it does not skew any proportions like an image tends to do.


Thanks. 


MG Mohanraj Gunasekaran Syncfusion Team June 24, 2019 02:02 PM UTC

Hi Travis, 

Thanks for your update. 

We can understand your scenario. We need some more time to achieve your requested requirement. So, we will check and update the details on 26th June 2019. 

Regards, 
Mohanraj G 


MG Mohanraj Gunasekaran Syncfusion Team June 26, 2019 02:24 PM UTC

Hi Travis, 

Thanks for your patience. 

Syncfusion PdfDocument doe not have the direct support to render the GridControl directly. You need to render the manually by iterating every grid cells and if the cell has a control, you could make that control as a image and render that image to the cell it will need more implementation to draw the pdf document. Please refer the following UG link, 


In our default GridPdfConverter render the image without reducing the quality. Please find the below screenshot, 

Exported pdf document 
  

If it is possible please share your sample application which you are facing the image quality issue while exporting to pdf. It will be helpful for us to provide the solution at the earliest. 

Regards, 
Mohanraj G 


Loader.
Live Chat Icon For mobile
Up arrow icon