- Home
- Forum
- ASP.NET MVC - EJ 2
- Map chart with custom background image
Map chart with custom background image
Dear all,
Our aim is setting some marker with value on a background image.
When we use your sample https://aspnetmvc.syncfusion.com/Maps/Seatbooking#/material to try
and insert a image as background. We found that the image can't be shown in div element.
Please help and advance, thx.
KennethT
SIGN IN To post a reply.
11 Replies
DD
Dharanidharan Dharmasivam
Syncfusion Team
February 15, 2019 09:30 AM UTC
Hi Kenneth,
Greetings from Syncfusion. We have analyzed your query. In the seating arrangement sample, we have used the customized shapes. We have online sample in which we have added images using the marker template in the below.
For more information on marker, kindly find the help document.
Since we are not clear with your exact requirement where you need to add background image, kindly share some screenshots with respect to your requirement or provide more information on your query. This will be much helpful in further analysis and provide you the solution sooner.
Thanks,
Dharani.
KT
Kenneth Tang
February 15, 2019 02:35 PM UTC
Dear Dharani,

We have use your reference to create with the following code
@using Syncfusion.EJ2
@using Syncfusion.EJ2.Maps
<div class="col-lg-9 control-section">
<div style="border: 3px solid #b6ff00;width: 600px;height: 400px;margin:auto;border-radius:5px;">
<div style="text-align:center">
<div id="container"></div>
@Html.EJS().Maps("container").Load("mapsLoad").Layers(layer =>
{
layer
.LayerType(Syncfusion.EJ2.Maps.ShapeLayerType.OSM).UrlTemplate("/Map/Sample_Floorplan.jpg"
).MarkerSettings(ViewBag.markerSettings).ShapeSettings(new MapsShapeSettings { Fill = "#C3E6ED" }
).SelectionSettings(new MapsSelectionSettings{ Enable = true, Opacity = 1, EnableMultiSelect = true }
).Add();
}).Render()
</div>
</div>
</div>
<style>
#control-container {
padding: 0px !important;
}
#seat-parent {
text-align: center;
cursor: pointer;
}
#selectedseats {
padding: 10px;
}
#selectedseats, #seat-info {
font-size: 14px;
}
#clear-btn {
padding: 10px;
border: 2px solid rgb(241, 235, 247);
border-radius: 8px;
background: rgb(246, 245, 248);
color: black;
font-size: 14px;
}
.seats {
padding-top: 15px;
font-weight: bold;
}
</style>
but we found that it would show the following outcome
please advance that how to shown the full floor plan map and we could also show to marker on the floor plan , thx.
KennethT
BP
Baby Palanidurai
Syncfusion Team
February 18, 2019 07:31 AM UTC
Hi Kenneth,
We have analyzed your query. You can the render the custom shapes for using the geometry type as ‘normal’ and using the custom coordinates as desired you want. And also place the marker for custom shapes by passing the coordinates into the marker latitude and longitude properties. You can render the floor plan map by using custom coordinates as desired you want. We have prepared a custom shape sample and place the marker.
Please find the below code snippet to achieve this custom shape and marker,
|
@Html.EJS().Maps("maps").Layers(m =>
{
m.GeometryType(GeometryType.Normal).MarkerSettings(ms =>
{
ms.Visible(true).DataSource(ViewBag.markerData).Add();
}).ShapeData(ViewBag.mapsData).Add();
}).Render()
busSheetData.json:
{ "type": "FeatureCollection", "features": [
{ "type": "Feature", "geometry": { "type": "MultiPolygon", "coordinates": [[[[0, 0], [0, 20], [20, 20], [20, 0], [0, 0]]], [[[0, 22], [0, 27], [20, 27], [20, 22], [0, 22]]]] }, "properties": { "seatno": 19, "fill": "gray" } },
. . .
. . . Add more data’s
] }
MarkerData:
List<MarkerData> data = new List<MarkerData>
{
new MarkerData { latitude= 94, longitude= 0, name= "Bottom left corner" },
. . .
. . . Add more data’s
};
ViewBag.markerData = data; |
Screenshot:

Sample for your reference, can be found from below link,
Kindly revert us, if you have any concerns.
Regards,
Baby.
KT
Kenneth Tang
February 19, 2019 04:00 AM UTC
Dear Baby,
Could we use jpg or png file as background rather that using custom coordinates ?
Please advance, thx.
KennethT
DD
Dharanidharan Dharmasivam
Syncfusion Team
February 19, 2019 12:39 PM UTC
Hi Kenneth,
We have analyzed your query. As of now, we are not having support for setting background image for maps. But as a workaround, we have achieved your requirement in the maps loaded event. And you need to add some dummy data for the maps. In the loaded event, we have added image element as a first child for the maps SVG element.
Please find the below code snippet to achieve this requirement,
|
@Html.EJS().Maps("maps").Loaded("loaded").Render()
var loaded = function (args) {
var parentSvg = document.getElementById(args.maps.element.id + '_svg');
if (!(parentSvg.firstChild).querySelector('image')) {
var imgElement = document.createElementNS(svgNS, 'image');
//Other configurations
parentSvg.insertBefore(imgElement, parentSvg.firstChild);
}
setTimeout(function () {
var BorderEle = document.getElementById(args.maps.element.id + '_MapBorder');
BorderEle.setAttribute('fill', 'transparent');
}, 100)
} |
Screenshot:

Sample for your reference, can be found from below link,
Regards,
Dharani.
KT
Kenneth Tang
March 1, 2019 02:29 AM UTC
Dear Dharani,
Thank for Info! We had successful to use your coding for display the background image with the map feature.
But we want more information to display when mouse over the marker, such as name & In / Out Count.
The following are our coding
chtml
<div id="template" style="display:none">
<div class="toolback">
<div class="listing2">
<center>
${name} , ${InCount}
</center>
</div>
</div>
</div>
<div class="row">
<div id="maps" stlye="display: block">
@Html.EJS().Maps("maps").Loaded("loaded").Layers(m =>
{
m.GeometryType(GeometryType.Normal).MarkerSettings(
ms =>
{
ms.Visible(true).Shape(MarkerType.Circle).Height(15).Width(15).TooltipSettings(ts => ts.Visible(true).ValuePath("camInfo").Template("template")).DataSource(ViewBag.markerdata).Add();
}
).ShapeData(ViewBag.mapsData).Add();
}
).MapsArea(ma =>ma.Background("transparent")).Render()
</div>
</div>
controllor
public ActionResult Test()
{
List<MarkerData> data = new List<MarkerData>
{
new MarkerData {
latitude = 94,
longitude = 0,
canInfo = new camInfo{
name = "10.99.33.100",
InCount = 400,
OutCount = 534
}
},
new MarkerData { latitude=47, longitude=20,
canInfo = new camInfo{
name = "10.99.33.101",
InCount = 4534,
OutCount = 934
}
},
new MarkerData { latitude= 20, longitude= 20,
canInfo = new camInfo{
name = "10.99.33.102",
InCount = 412,
OutCount = 234
} }
};
ViewBag.markerData = data;
return View();
}
Please advance & thx.
KennethT
DD
Dharanidharan Dharmasivam
Syncfusion Team
March 1, 2019 11:57 AM UTC
Hi Kenneth,
Thanks for your information. We have analyzed your query and from the provided code snippet we found that you have skipped to use ‘#’ symbol in the template. So, the template is not loaded. Find the code snippet to achieve this.
|
@Html.EJS().Maps("maps").Layers(m =>{
m.MarkerSettings( ms => {
ms.TooltipSettings(ts => ts.Template("#template")).Add();
})
}).Render()
|
Screenshot:

Thanks,
Dharani.
KT
Kenneth Tang
July 4, 2019 05:33 AM UTC
Dear Dharani,
Thank for your sharing, could we change the dot color on the map base on markerdata value? such as inCount > 1000, display red dot otherwise display green dot.
Please advance, thx.
KennethT
BP
Baby Palanidurai
Syncfusion Team
July 5, 2019 07:16 AM UTC
Hi Kenneth,
Thanks for your update.
We have analyzed your query. You can customize the marker fill in the markerRendering event. Please find the below code snippet to achieve this requirement,
|
Controller.cs
List<MarkerData> data = new List<MarkerData>
{
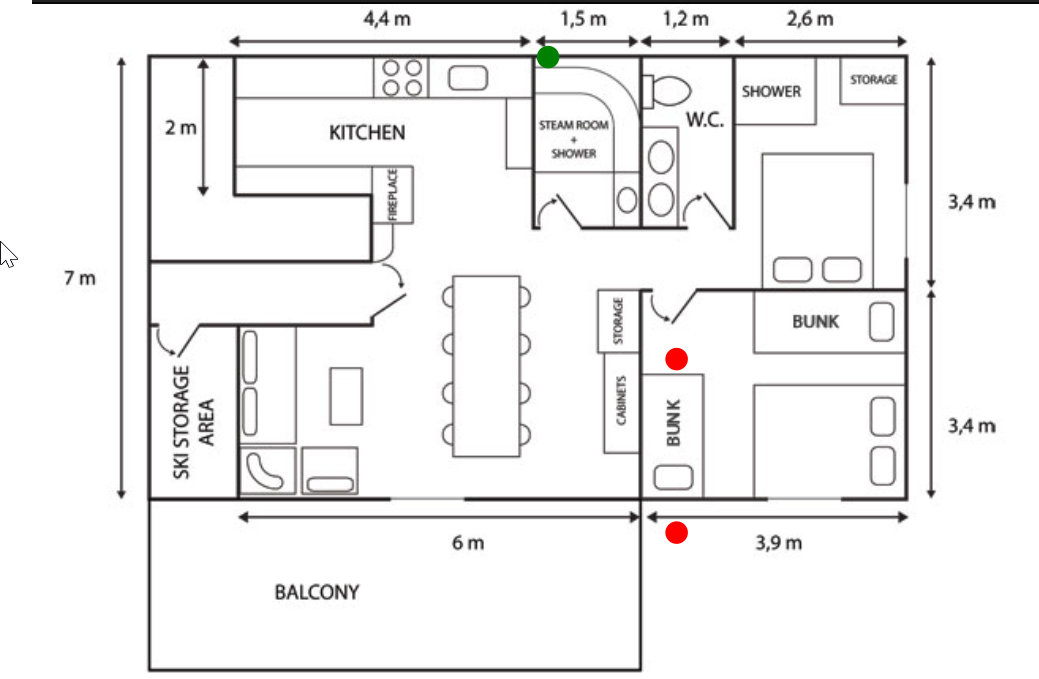
new MarkerData { latitude= 94, longitude= 0, value = 900 },
new MarkerData { latitude=47, longitude=20, value= 2200 },
new MarkerData { latitude= 20, longitude= 20, value= 3000 }
};
ViewBag.markerData = data;
.cshtml:
@Html.EJS().Maps("maps").MarkerRendering("markerRendering").Layers(m =>
{
m.GeometryType(GeometryType.Normal).MarkerSettings(ms => {
ms.Visible(true).Shape(MarkerType.Circle).Height(15).Width(15).TooltipSettings(ts => ts.Visible(true).ValuePath("value")).DataSource(ViewBag.markerData).Add();
}).ShapeData(ViewBag.mapsData).Add();
}
).MapsArea(ma =>ma.Background("transparent")).Render()
var markerRendering = function (args) {
if (args.data.value > 1000) {
args.fill = 'red';
} else {
args.fill = 'green';
}
} |
Screenshot:
Kindly revert us, if you have any concerns.
Regards,
Baby.
KT
Kenneth Tang
October 12, 2019 02:55 PM UTC
Dear Baby,
Thank for your sharing. Could we add the click event on each of marker also ?
Please advance & thank.
KennethT
BP
Baby Palanidurai
Syncfusion Team
October 14, 2019 06:23 AM UTC
Hi Kenneth,
Thanks for your update.
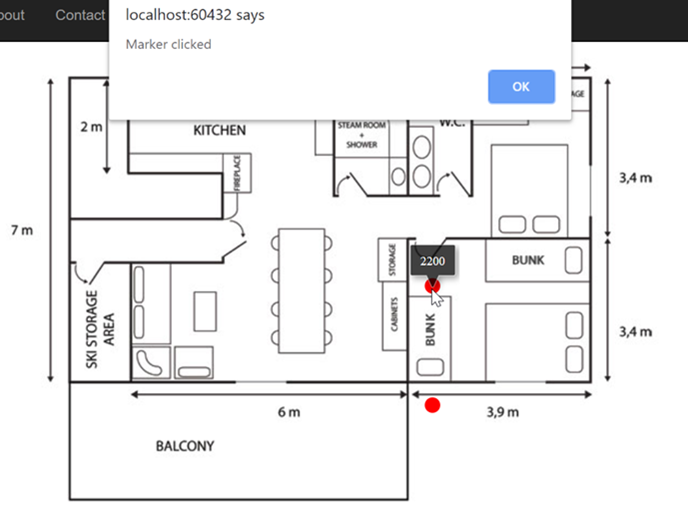
We have analyzed your query. We are having markerClick event for markers click. We have prepared a maps sample with a marker click event. In that sample, we have shown an alert box for the marker click. Please find the below code snippet to achieve this requirement,
|
<div id="maps" stlye="display: block">
@Html.EJS().Maps("maps").Loaded("loaded").MarkerClick("markerClick").Render()
</div>
var markerClick = function (args) {
alert("Marker clicked");
} |
Screenshot:
Sample link: https://www.syncfusion.com/downloads/support/directtrac/general/ze/CustomMapsClick943903679
Kindly revert us, if you have any other concerns.
Regards,
Baby.
SIGN IN To post a reply.
- 11 Replies
- 3 Participants
-
KT Kenneth Tang
- Feb 15, 2019 03:54 AM UTC
- Oct 14, 2019 06:23 AM UTC
