- Home
- Forum
- Xamarin.Forms
- Annotation outside of data doesn't show
Annotation outside of data doesn't show
Hi, I'm creating a graph which tracks a users weight.
I have some test data:
new WeighIn { DateWeighed = DateTime.Now.AddDays(-7), Weight = 50},
new WeighIn { DateWeighed = DateTime.Now.AddDays(-6), Weight = 55},
new WeighIn { DateWeighed = DateTime.Now.AddDays(-5), Weight = 58},
new WeighIn { DateWeighed = DateTime.Now.AddDays(-4), Weight = 55},
new WeighIn { DateWeighed = DateTime.Now.AddDays(-3), Weight = 53},
new WeighIn { DateWeighed = DateTime.Now.AddDays(-2), Weight = 48}
If I create a horizontal line annotation between those numbers (48 - 58) the annotation appears.
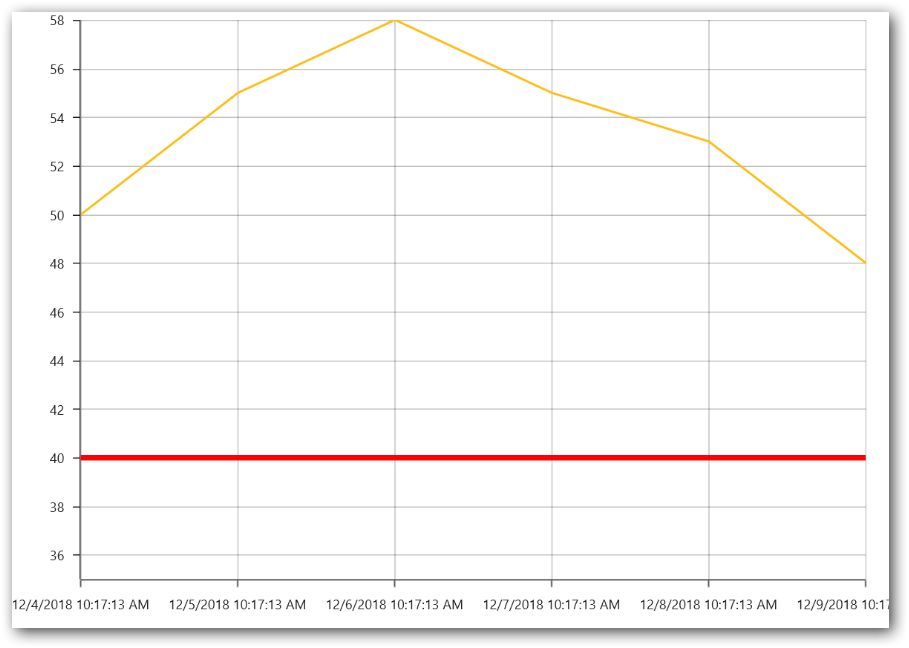
But let's say I set myself a target weigh of 40. I want to add a horizontal line annotation at 40, but it doesn't appear. I was hoping with the annotation specified the Y axis would expand to show this horizontal line. So I'm after a graph that shows my weight but underneath my target weight line, which I'm yet to achieve.
Can you suggest another way to accomplish then, or am I going about it the wrong way?
Thanks.
SIGN IN To post a reply.
4 Replies
RI
Ricky
December 10, 2018 03:50 PM UTC
Note, I have managed to achieve this, but still feels it's the wrong method and that's by creating another line series, duplicating the dates but setting all the values to the target weight, i.e.:
new WeighIn { DateWeighed = DateTime.Now.AddDays(-7), Weight = 40},
new WeighIn { DateWeighed = DateTime.Now.AddDays(-6), Weight = 40},
new WeighIn { DateWeighed = DateTime.Now.AddDays(-5), Weight = 40},
new WeighIn { DateWeighed = DateTime.Now.AddDays(-4), Weight = 40},
new WeighIn { DateWeighed = DateTime.Now.AddDays(-3), Weight = 40},
new WeighIn { DateWeighed = DateTime.Now.AddDays(-2), Weight = 40}
MP
Michael Prabhu M
Syncfusion Team
December 11, 2018 05:15 AM UTC
Hi Ricky,
Greetings from Syncfusion.
Query 1: But let's say I set myself a target weigh of 40. I want to add a horizontal line annotation at 40, but it doesn't appear. I was hoping with the annotation specified the Y axis would expand to show this horizontal line. So I'm after a graph that shows my weight but underneath my target weight line, which I'm yet to achieve.
We would like to let you know that Y-Axis ranges are calculated based on minimum and maximum of the ItemsSource values. So, it does not expand based on Annotations. You can achieve your requirement by set Minimum value as 35 or 0 to SecondaryAxis. Please refer below code snippet.
Code snippet[XAML]
|
<chart:SfChart.SecondaryAxis>
<chart:NumericalAxis Minimum="35"/>
</chart:SfChart.SecondaryAxis> |
Code snippet[C#]
|
chart.SecondaryAxis = new NumericalAxis() { Minimum = 35}; |
We have prepared a sample based on this and it can be downloaded from the link below.
Sample: 141408
Screenshot:
Hope this helps.
Regards,
Michael
RI
Ricky
December 11, 2018 10:22 AM UTC
Thanks! That helps, excellent support by the way.
MP
Michael Prabhu M
Syncfusion Team
December 11, 2018 10:40 AM UTC
Hi Ricky,
Glad we could help, feel free to contact us any time if you need any other assistance from us.
Thanks,
Michael
SIGN IN To post a reply.
- 4 Replies
- 2 Participants
-
RI Ricky
- Dec 10, 2018 03:42 PM UTC
- Dec 11, 2018 10:40 AM UTC

