Add tooltip on Headerdfsfdfg
Hi,
Attachment: tooltip_1cf1f176.rar
I'd like to know how can I add tool-tip with predefined text on the headers. The text may contain 3 lines.
E.g. The tooltip will display a predefined description.
See attached.
Thanks,
Liron
Attachment: tooltip_1cf1f176.rar
SIGN IN To post a reply.
17 Replies
VK
Vinoth Krishnamoorthy
Syncfusion Team
October 29, 2018 09:58 AM UTC
Hi Liron,
Thanks for contacting Syncfusion support.
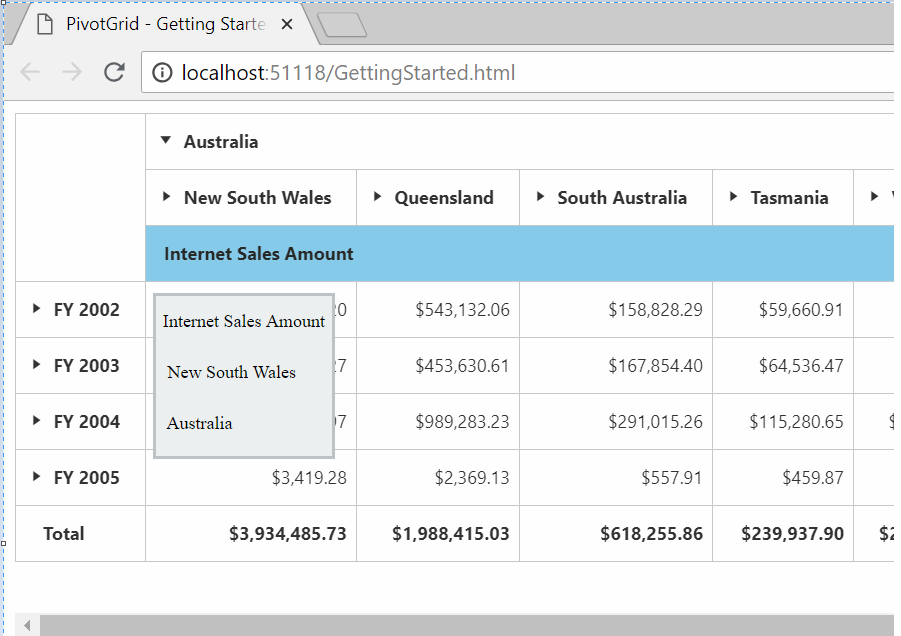
You can add tooltip for Pivot Grid headers using “renderSuccess” event. Find the code snippet, sample link and reference screenshot link from below:
Cod Snippet: [CSS]
| <style> .customHeaderTooltip { position: fixed !important; z-index: 500; display: none; border-width: 10px; height: auto; display:inline !important; background: #ecf0f1; border: 2px solid #bdc3c7; } .headerTooltipText { font-size: 12px; text-align: left; height: auto; font-weight: normal; margin: 5px 0 10px 0; opacity:1; padding: 5px; } </style> |
Code Snippet: [JavaScript]
| $("#PivotGrid1").ejPivotGrid( { url: "/Olap", renderSuccess: "renderSuccess" }); function renderSuccess() { $(".colheader").hover(function (e) { $("#gridTooltip").remove(); var pGridObj = $("#PivotGrid1").data("ejPivotGrid"); var targetHeader = e.target; var text = "predefined text"; // You can customize your text here $("#PivotGrid1").append("<div id='gridTooltip' class='customHeaderTooltip' role='tooltip'></div>"); $("#gridTooltip").append("<p class='headerTooltipText'>" + text + "</p>\n<p class='headerTooltipText'>" + text + "</p>\n<p class='headerTooltipText'>" + text + "</p>"); var containerEndPos = 0; var tdPos = targetHeader.getBoundingClientRect(); containerEndPos = $("#PivotGrid1").parent().position().left + $("#PivotGrid1").parent().width(); var tooltipEndPos = tdPos.left + $("#gridTooltip").width(); var leftPos = 0, topPos = 0; leftPos = (tdPos.left > 0 ? tdPos.left : 0) + ((containerEndPos - tooltipEndPos) < 0 ? ((containerEndPos - tooltipEndPos) - 20) : 5); topPos = ($(pGridObj.element).height() - tdPos.top) < 100 ? (tdPos.top - $("#gridTooltip").outerHeight() - 2) : tdPos.top + 40; $("#gridTooltip").css({ left: leftPos, top: topPos }); }); $(".colheader").mouseleave(function (e) { $("#gridTooltip").remove(); }); } |
Reference Screenshot Link: https://www.syncfusion.com/downloads/support/directtrac/140603/sshot-11544935507
Please let us know if you need any further assistance on this.
Regards,
Vinoth K.
LM
Liron Marcus
October 31, 2018 09:24 AM UTC
Thanks,
Two questions:
1. I can I apply different text to a different column?
2. How can I do the same but for PivotChart?
Thanks,
Liron
SU
Suriya
Syncfusion Team
November 1, 2018 05:25 AM UTC
Hi Liron,
Thanks for the update. Please find the response below.
| Query | Response | |
| 1. I can I apply different text to a different column? | For PivotGrid, you can change tooltip text dynamically through the below code snippet. Code Snippet [JavaScript]:
 Also, refer to the sample for the above changes: https://www.syncfusion.com/downloads/support/forum/140603/ze/PivotGridDemo-858883662 | |
| 2. How can I do the same but for PivotChart? | You can customize the tooltip text in PivotChart through the args.data.currentText in the “toolTipInitialize” event. Please refer the code snippet below. Code Snippet: [JavaScript]
Please find the below sample link for your reference. Sample Link: https://jsplayground.syncfusion.com/backxq2m |
If this does not match your requirement, please get back to us with some more details.
Regards,
Suriya
LM
Liron Marcus
November 1, 2018 08:48 AM UTC
Thanks but how can I set a different text to different column based on the column index for example.
i.e. table that has 3 columns, each column will have a different text.
SU
Suriya
Syncfusion Team
November 1, 2018 12:06 PM UTC
Hi Liron,
We have displayed the Tooltip based on column index. Please refer the code snippet below.
Code Snippet: [JavaScript]
| $(".colheader, .summary").not(".customHeaderTooltip").hover(function (e) { $("#gridTooltip").remove(); if ($(e.target).text() != null && $(e.target).text() != " ") { var pGridObj = $("#PivotGrid1").data("ejPivotGrid"); var toolTipText = ""; if (!ej.isNullOrUndefined($(e.target).parent().find("th.colheader:eq(0)").attr("data-p"))) { columnHeaderCount = parseInt($(e.target).parent().find("th.colheader:eq(0)").attr("data-p").split(',')[0]) + parseInt($(e.target).parent().find("th.colheader:eq(0)").attr("data-p").split(',')[1]); toolTipText = $(e.target).attr("role") + " " + (columnHeaderCount - 1); // You can get current column index through (columnHeaderCount - 1) } $("#PivotGrid1").append("<div id='gridTooltip' class='customHeaderTooltip' role='tooltip'></div>"); $("#gridTooltip").append("<p class='headerTooltipText'>" + toolTipText + "</p>\n"); var containerEndPos = 0; var tdPos = e.target.getBoundingClientRect(); containerEndPos = $("#PivotGrid1").parent().position().left + $("#PivotGrid1").parent().width(); var tooltipEndPos = tdPos.left + $("#gridTooltip").width(); var leftPos = 0, topPos = 0; leftPos = (tdPos.left > 0 ? tdPos.left : 0) + ((containerEndPos - tooltipEndPos) < 0 ? ((containerEndPos - tooltipEndPos) - 20) : 5); topPos = ($(pGridObj.element).height() - tdPos.top) < 100 ? (tdPos.top - $("#gridTooltip").outerHeight() - 2) : tdPos.top + 40; $("#gridTooltip").css({ left: leftPos, top: topPos +5 }); } }); $(".colheader, .summary, .customHeaderTooltip").mouseleave(function (e) { $("#gridTooltip").remove(); }); } |
Sample html file: https://www.syncfusion.com/downloads/support/forum/140679/ze/GettingStarted-1288470676
Regards,
Suriya
LM
Liron Marcus
November 1, 2018 12:59 PM UTC
The video is corrupted and also your example.
I can't see from your snippet how the text assigned to each column. I was expected to see a loop over all column but I didn't see that.
Please advise,
Liron
SU
Suriya
Syncfusion Team
November 2, 2018 07:36 AM UTC
Hi Liron,
Sorry for the inconvenience.
You can directly retrieve the column index for current cell without any looping. Please use make use of “data-p” attribute of the hovered cell to retrieve column index.
We have prepared sample to retrieve column index and column number for PivotGrid column header cell(s).
| Column Index | Column Number |
| Code snippet: ColumnIndex = $(e.target).attr("data-p").split(',')[0]); Screenshot1: 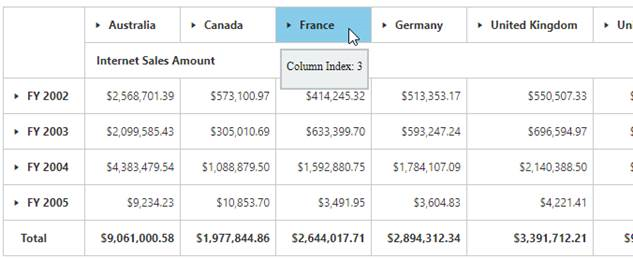 | Code snippet: columnHeaderCount = parseInt($($(targetElement)).attr("data-p").split(',')[0]) - (parseInt($("[data-p='0,0'").attr("colspan"))-1); Output: 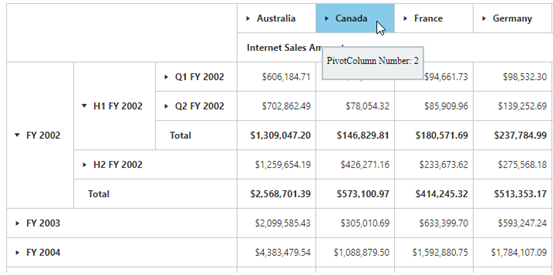 |
Regards,
Suriya
LM
Liron Marcus
November 3, 2018 06:41 PM UTC
I have tried to implement your solution, copy the code but it fails in the following line:
columnHeaderCount = parseInt($($(targetElement)).attr("data-p").split(',')[0]);
the reason is that $($(targetElement)) is
defined, however, the attribute data-p is
undefined: ie. $($(targetElement)).attr("data-p") is undefined
It should be a simple request. Any reason why it takes to much replies to work???
SU
Suriya
Syncfusion Team
November 5, 2018 05:32 AM UTC
Hi Liron,
Sorry for the confusion.
We have upgraded our source with HTML 5 migration. As per the rules of HTML 5, we have maintained our custom attributes with the prefix “data-”. But, with your version (14.4.0.20), we have used older version of HTML with the custom attribute as “p” instead “data-p”.
Please refer the code snippet below.
Code Snippet: [JavaScript]
| columnHeaderCount = parseInt($($(targetElement)).attr("p").split(',')[0]) - (parseInt($("[p='0,0'").attr("colspan"))-1); |
Meanwhile, we have prepared a sample for your convenience. Please find the sample Link below.
Screenshot:
| Older Version | Latest Version |
| Version: 14.4.0.20 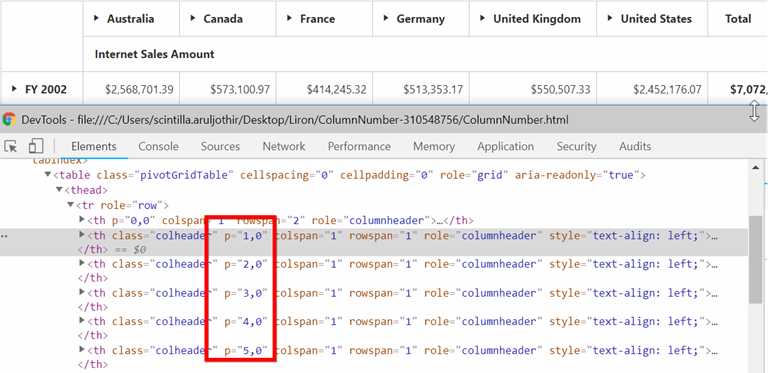 | Version: 16.3.0.21 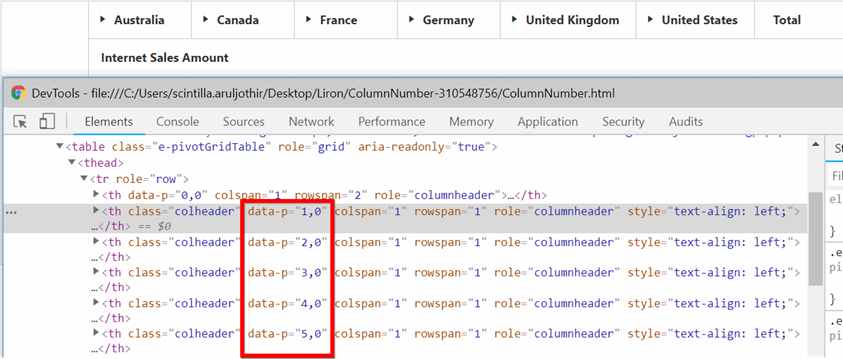 |
Regards,
Suriya
LM
Liron Marcus
November 5, 2018 05:31 PM UTC
Thanks, that seems to work now.
How do I apply the same but for the PivotChart?
SA
Scintilla Arul Jothi Raj
Syncfusion Team
November 6, 2018 08:32 AM UTC
Hi Liron,
You can get the series index and point index of PivotChart through the “toolTipInitialize” event. Please refer the code snippet below.
Code Snippet: [JavaScript]
|
$("#PivotChart1").ejPivotChart({
//dataSource
toolTipInitialize: "toolTipInitialize"
});
function toolTipInitialize(args) {
args.data.currentText = "PointIndex " + (args.data.pointIndex) + " SeriesIndex " + (args.data.seriesIndex);/*You can get the point Index and series index here
Point Index: Index of series collection
Series Index: Index of each series*/
} |
Screenshot:

Meanwhile, we have prepared a sample for your convenience. Please find the sample in the below link.
Video Link:http://www.syncfusion.com/downloads/support/forum/140679/ze/Series_and_Point_Index-1674067065
Please let us know, if you have any concerns.
Regards,
Scintilla A
LM
Liron Marcus
November 6, 2018 10:28 AM UTC
Thanks, However, I meant to have the tooltip displayed on the legend.
Attachment: pivotChartShowTooltip_9a4c0212.rar
See attached the screenshot convey from where I'd like the tooltip display
Attachment: pivotChartShowTooltip_9a4c0212.rar
SA
Scintilla Arul Jothi Raj
Syncfusion Team
November 6, 2018 02:07 PM UTC
Hi Liron,
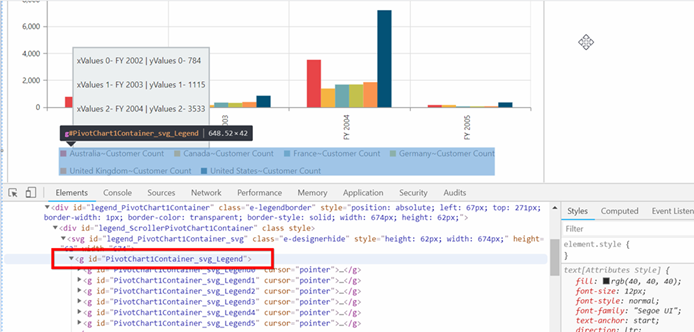
You can show the Tooltip on legend by the “legendMouseMoveItem” event. Now, we have shown the series items on Tooltip, which is related to the legend (currently hovered). And, to clear Tooltip while leaving legend item, you can raise “mouseleave” event on “renderSuccess” event of PivotChart.
Please refer the code snippet below.
Code Snippet: [JavaScript]
|
$("#PivotChart1").ejPivotChart({
//dataSource
legendItemMouseMove: "legendItemMouseMove",
renderSuccess: "renderSuccess"
});
function renderSuccess() {
$("[id*=PivotChart1Container_svg_Legend]").mouseleave(function (args) {
$("#chartTooltip").remove();
});
}
function legendItemMouseMove(args) {
$("#chartTooltip").remove();
pChartObj = $("#PivotChart1").data("ejPivotChart");
if (!ej.isNullOrUndefined(args.model.event.target)) {
$("#PivotChart1").append("<div id='chartTooltip' class='customHeaderTooltip' role='tooltip'></div>");
for (var i = 0; i < args.data.series.dataSource.length; i++) {
$("#chartTooltip").append("<p class='headerTooltipText'> xValues " + i + "- " + args.data.series.dataSource[i].xValues + " | yValues " + i + "- " + args.data.series.dataSource[i].yValues + "</p>\n");
}
var containerEndPos = 0;
var tdPos = args.model.event.target.getBoundingClientRect();
containerEndPos = $("#PivotChart1").parent().position().left + $("#PivotChart1").parent().width();
var tooltipEndPos = tdPos.left + $("#chartTooltip").width();
var leftPos = 0, topPos = 0;
leftPos = (tdPos.left > 0 ? tdPos.left : 0) + ((containerEndPos - tooltipEndPos) < 0 ? ((containerEndPos - tooltipEndPos) - 20) : 5);
topPos = ($(pChartObj.element).height() - tdPos.top) < 100 ? (tdPos.top - $("#chartTooltip").outerHeight() - 2) : tdPos.top + 40;
$("#chartTooltip").css({ left: leftPos, top: topPos + 5 });
}
} |
Code Snippet: [CSS]
|
<style>
.customHeaderTooltip {
position: fixed !important;
z-index: 500;
display: none;
border-width: 10px;
height: auto;
display: inline !important;
background: #ecf0f1;
border: 2px solid #bdc3c7;
}
.headerTooltipText {
font-size: 12px;
text-align: left;
height: auto;
font-weight: normal;
margin: 5px 0 10px 0;
opacity: 1;
padding: 5px;
}
</style> |
Meanwhile, we have prepared a sample for your convenience. Please find the sample in the below link
Screenshot:

Regards,
Scintilla A
LM
Liron Marcus
November 6, 2018 02:42 PM UTC
Thank you,
There are cases where the mouse is out of the element but the tooltip is still shown.
Please advise,
Liron
VK
Vinoth Krishnamoorthy
Syncfusion Team
November 7, 2018 06:52 AM UTC
Hi Liron,
We are able to reproduce the reported issue only if we open the console window and perform the mouse leave action. We also suspect that the issue occurs due to improper provision of PivotChartContainer ID in the “mouseleave” event.
Include “mouseleave” event in the “legendItemMouseMove” instead “renderSuccess” event to overcome the tooltip issue while opening console window. Please refer the code snippet below.
Code snippet: [JavaScript]
| function legendItemMouseMove(args) { $("#chartTooltip").remove(); pChartObj = $("#PivotChart1").data("ejPivotChart"); if (!ej.isNullOrUndefined(args.model.event.target)) { $("#PivotChart1").append("<div id='chartTooltip' class='customHeaderTooltip' role='tooltip'></div>"); for (var i = 0; i < args.data.series.dataSource.length; i++) { $("#chartTooltip").append("<p class='headerTooltipText'> xValues " + i + "- " + args.data.series.dataSource[i].xValues + " | yValues " + i + "- " + args.data.series.dataSource[i].yValues + "</p>\n"); } var containerEndPos = 0; var tdPos = args.model.event.target.getBoundingClientRect(); containerEndPos = $("#PivotChart1").parent().position().left + $("#PivotChart1").parent().width(); var tooltipEndPos = tdPos.left + $("#chartTooltip").width(); var leftPos = 0, topPos = 0; leftPos = (tdPos.left > 0 ? tdPos.left : 0) + ((containerEndPos - tooltipEndPos) < 0 ? ((containerEndPos - tooltipEndPos) - 20) : 5); topPos = ($(pChartObj.element).height() - tdPos.top) < 100 ? (tdPos.top - $("#chartTooltip").outerHeight() - 2) : tdPos.top + 40; $("#chartTooltip").css({ left: leftPos, top: topPos + 5 }); } $("[id*=PivotChart1Container_svg_Legend]").mouseleave(function (args) { $("#chartTooltip").remove(); }); } |
Screenshot Link:
Please let us know if you are able to replicate this issue in some other scenario or after using the modified sample.
Regards,
Vinoth K.
LM
Liron Marcus
November 8, 2018 01:21 PM UTC
Your provided solution didn't resolve the issue but even made it worse
VK
Vinoth Krishnamoorthy
Syncfusion Team
November 9, 2018 05:35 AM UTC
HI Liron,
The sample provided to you is working fine for us in all possible scenarios. We have attached a demo video for you reference.
Could you please replicate the issues you are facing in the provided sample and sent back to us? Also, share us the demo video if there is no source level change required.
Regards,
Vinoth K.
SIGN IN To post a reply.
- 17 Replies
- 4 Participants
-
LM Liron Marcus
- Oct 28, 2018 02:06 PM UTC
- Nov 9, 2018 05:35 AM UTC
