Not able to set Min Max Range on Chart when Logarithmic choosen
Dear Team,
I am trying to set the min max values for a chart y axis. When when I compile, I see
This is the code I use in c#:
this._seriesChartControl.PrimaryYAxis.ValueType = Syncfusion.Windows.Forms.Chart.ChartValueType.Logarithmic;
this._seriesChartControl.PrimaryYAxis.RangeType = Syncfusion.Windows.Forms.Chart.ChartAxisRangeType.Set;
this._seriesChartControl.PrimaryYAxis.Range = new Syncfusion.Windows.Forms.Chart.MinMaxInfo(500, 10000, 1000);
this._seriesChartControl.PrimaryYAxis.Range = new Syncfusion.Windows.Forms.Chart.MinMaxInfo(500, 10000, 1000);
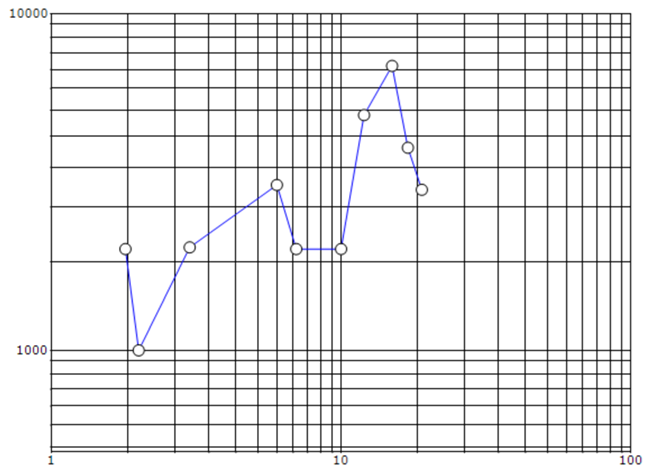
See attached, how the Chart looks, when in designer and when compiled.
I am using latest build 2017 vxx.
Thanks
Mike
Attachment: 20170816_compiled_99578fcc.zip
SIGN IN To post a reply.
3 Replies
DD
Dharanidharan Dharmasivam
Syncfusion Team
August 17, 2017 01:08 PM UTC
Hi Michael ,
Thanks for contacting Syncfusion support.
We have analyzed your query. From the provided code snippet we found that you are rendering y axis as logarithmic. If so then you need to specify the range also in logarithmic values, then only the chart will render properly. We have prepared a simple sample to depict this behavior. Find the code snippet below to achieve this requirement.
| Windows forms: this.chart.PrimaryYAxis.Range = new Syncfusion.Windows.Forms.Chart.MinMaxInfo(Math.Log(500,10), Math.Log(10000,10), Math.Log(1,10)); |
By default the y axis labels will be rendered with respect to the specified range. If you need the output of y axis labels in 10 power format, then you need to specify LogLabelsDisplayMode property as IntegerLogValues, so that y axis labels will render in 10 multiples i.e 100,1000,10000, etc with respect to the specified range. Find the code snippet below.
| Windows Forms: this.chart.PrimaryYAxis.LogLabelsDisplayMode = LogLabelsDisplayMode.IntegerLogValues; |
Screenshot:
Sample for reference can be find from below link.
Kindly revert us, if you have any concern.
Thanks,
Dharani.
MA
Michael Ahrndt
August 18, 2017 03:31 PM UTC
Thanks for that.
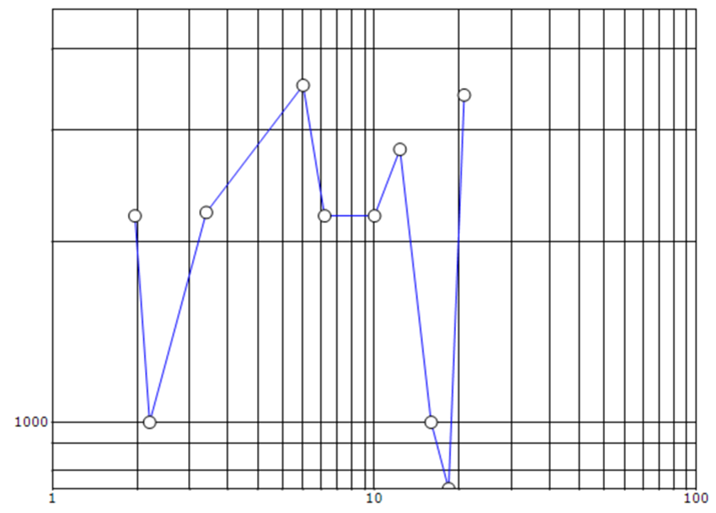
Now, it gets displayed like this, on the left side of the chart, when I use this both:
this._seriesChartControl.PrimaryYAxis.Range = new Syncfusion.Windows.Forms.Chart.MinMaxInfo(System.Math.Log(800, 10), System.Math.Log(4000, 10), System.Math.Log(10, 10));
this._seriesChartControl.PrimaryYAxis.ValueType = Syncfusion.Windows.Forms.Chart.ChartValueType.Logarithmic;
this._seriesChartControl.PrimaryYAxis.LogLabelsDisplayMode = Syncfusion.Windows.Forms.Chart.LogLabelsDisplayMode.IntegerLogValues
Attachment: 20170818_funny_display_ed7fb153.zip
DD
Dharanidharan Dharmasivam
Syncfusion Team
August 21, 2017 10:57 AM UTC
Hi Michael,
Sorry for the inconvenience.
The reported scenario can be overcome using the ChartFormatAxisLabel event. In this event you can able to get the text to be displayed and you can customize with respect to your requirement. In this we have rounded the y axis label. Find the code snippet to achieve this requirement.
| Windows Forms: this.chart.ChartFormatAxisLabel += chart_ChartFormatAxisLabel; void chart_ChartFormatAxisLabel(object sender, ChartFormatAxisLabelEventArgs e) { if (e.AxisOrientation == ChartOrientation.Vertical) e.Label = Convert.ToString(Math.Round(e.Value)); e.Handled = true; } |
Also we would like to let you know that since you are displaying y axis as logarithmic axis and by specifying LogLabelsDisplayMode property as IntegerLogValues displayed the values in 10 power format, the y axis labels which are of multiples of 10 will be visible i.e 10, 100, 1000 and so on. In the sample the minimum value of y axis is log value of 800 and maximum value is log value of 4000, in between these minimum and maximum value multiples of 10(10 power format) is 1000, so this value is only visible in the chart.
Screenshot:
Sample for reference can be find from the below link.
Kindly revert us, if you have any concerns.
Thanks,
Dharani.
SIGN IN To post a reply.
- 3 Replies
- 2 Participants
-
MA Michael Ahrndt
- Aug 16, 2017 11:31 AM UTC
- Aug 21, 2017 10:57 AM UTC
