dasharray in sfchart
3 Replies
DA
Devi Aruna Maharasi Murugan
Syncfusion Team
August 14, 2017 09:03 AM UTC
Hi Rex,
Thanks for contacting Syncfusion Support.
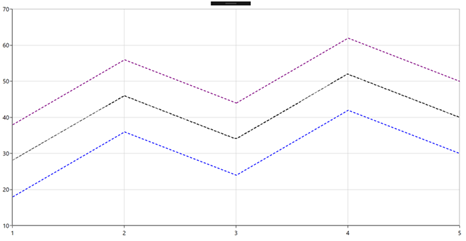
1)With FastLineSeries
We can display dash-line series by setting the StrokeDashArray property of FastLineSeries and it can be set as shown in the below code snippet,
| FastLineSeries series1 = new FastLineSeries() { StrokeDashArray = new DoubleCollection() { 2, 2 }, Interior = new SolidColorBrush(Colors.Blue) }; chart.Series.Add(series1); |
2) With FastLineBitmapSeries
This requirement can also be achieved by using FastLineBitmapSeries with its StrokeDashArray property
| FastLineBitmapSeries series2 = new FastLineBitmapSeries() { StrokeDashArray = new DoubleCollection() { 3, 2 }, Interior = new SolidColorBrush(Colors.Black) }; chart.Series.Add(series2); |
3) With LineSeries
We can achieve your requirement (dash- line series) by using the CustomTemplate property for LineSeries and it can be set as shown in the below code snippet,
| FrameworkElementFactory lineFactory = new FrameworkElementFactory(typeof(Line)); lineFactory.SetValue(Line.StrokeDashArrayProperty, new DoubleCollection() { 3, 2 }); lineFactory.SetValue(Line.StrokeProperty, new Binding() { Path = new PropertyPath("Interior")}); lineFactory.SetValue(Line.StrokeThicknessProperty, new Binding() { Path = new PropertyPath("StrokeThickness") }); lineFactory.SetValue(Line.X1Property, new Binding() { Path = new PropertyPath("X1")}); lineFactory.SetValue(Line.X2Property, new Binding() { Path = new PropertyPath("X2")}); lineFactory.SetValue(Line.Y1Property, new Binding() { Path = new PropertyPath("Y1")}); lineFactory.SetValue(Line.Y2Property, new Binding() { Path = new PropertyPath("Y2")}); LineSeries series3 = new LineSeries() { Interior = new SolidColorBrush(Colors.Purple), CustomTemplate = new DataTemplate() { VisualTree = lineFactory } }; chart.Series.Add(series3); |
Please find the output screenshot,
The demo sample can be downloaded from below link,
Sample: DashArray_132087
Regards,
Devi
RE
Rex
August 15, 2017 10:45 AM UTC
many tnx Devi.
DS
Durgadevi Selvaraj
Syncfusion Team
August 16, 2017 04:08 AM UTC
Hi Rex,
Please let us know if your need any further assistance.
Regards,
Durgadevi S
SIGN IN To post a reply.
- 3 Replies
- 3 Participants
-
RE Rex
- Aug 13, 2017 10:37 AM UTC
- Aug 16, 2017 04:08 AM UTC
