- Home
- Forum
- ASP.NET MVC
- multiple series chart
multiple series chart
AverageAnswerByGroupAndDemographic abgd = new AverageAnswerByGroupAndDemographic();
abgd.Demographic = Demographic;
abgd.SurveyNumber = SurveyNumber;
abgd.GroupNumber = 1;
List<AverageDemographicGroupAnswer_Result> avg1 = abgd.AverageGroupScoresByDemographic();
ViewBag.Chart1Data = avg1;@(Html.EJ().Chart("chartContainer")
// ...
.Series(sr =>
{
sr.DataSource(ViewBag.Chart1Data)
.XName("ResponseText").YName("Total")
.Add();
})|
ASP.NET MVC:
Controller:
List<ChartData> data = new List<ChartData>();
data.Add(new ChartData("Big Text Bank encourages and supports a healthy", 4,4,4.5,4.5));
data.Add(new ChartData("I consider Big Tex Bank to be diverse, refelcting", 4,4.67,4.5,4));
data.Add(new ChartData("I look forward to coming to work every day", 5,4,4.5,4.33));
data.Add(new ChartData("I would refer a friend to work here", 5,4.67,4.5,4.67));
ViewBag.dataSource = data;
View page:
@(Html.EJ().Chart("container")
.Series(sr =>
{
sr.DataSource(ViewBag.dataSource).XName("Xvalue").YName("YValue1").Add();
sr.DataSource(ViewBag.dataSource).XName("Xvalue").YName("YValue2").Add();
sr.DataSource(ViewBag.dataSource).XName("Xvalue").YName("YValue3").Add();
sr.DataSource(ViewBag.dataSource).XName("Xvalue").YName("YValue4").Add();
})
//...
)
|

|
Stored procedure:
CREATE PROCEDURE [dbo].[ChartData]
AS
BEGIN
SET NOCOUNT ON;
SELECT * FROM Orders
END
RETURN 0
View page:
@(Html.EJ().Chart("container")
.Load("chartLoad")
)
function chartLoad(sender) {
$.ajax({
type: "POST",
url: '@Url.Action("DataSource", "Home")',
async: false,
success: function (data) {
sender.model.series = [];
//Bind the data source to chart as above with respect to your series length
}
});
}
Controller:
public ActionResult DataSource(DataManager dm)
{
DataOperations operation = new DataOperations();
DataTable dt = new DataTable("Order");
string constring = ConfigurationManager.ConnectionStrings["NORTHWNDConnectionString"].ConnectionString;
using (SqlConnection con = new SqlConnection(constring))
{
using (SqlCommand cmd = new SqlCommand("ChartData", con))
{
con.Open();
SqlDataReader dr = cmd.ExecuteReader();
// Load into the dataTable
dt.Load(dr);
dr.Close();
con.Close();
}
}
//Convert the dataTable into list
List<EditableOrder> resList = new List<EditableOrder>();
//...
return Json(new { result = resList }, JsonRequestBehavior.AllowGet);
}
|
Your example assumes I know the data at build time. I don't know the data.
Here is what I have in the controller
public ActionResult DemographicsReport(int SurveyNumber, int Demographic, SurveyDefinition survey)
{
/..
//Section 1: Attitudes & Perceptions ---------------------------------------------------------------------------------
ViewBag.Group1Text = survey.GetGroupText(1);
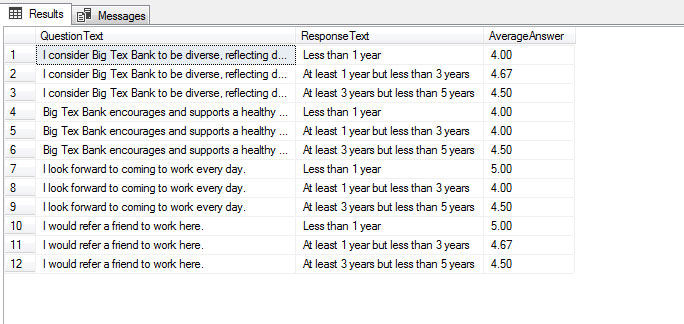
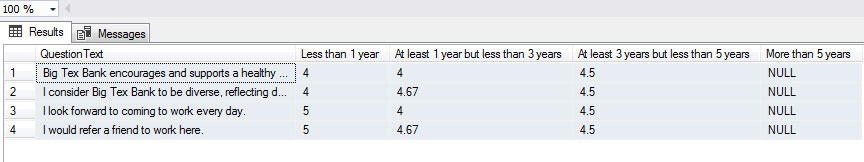
ViewBag.Group1Data = survey.GetPivotedDemographics(1, SurveyNumber, Demographic);
List<ChartData> data = new List<ChartData>();
data.Add(new ChartData(survey.GetPivotedDemographics(1, SurveyNumber, Demographic)));
ViewBag.Group1DataChart = data;
/..
return View();
}
[Serializable]
public class ChartData
{
private dynamic dynamic;
public ChartData(string xval, double yvalue, double yvalue2, double? yvalue3, double? yvalue4, double? yvalue5, double? yvalue6, double? yvalue7, double? yvalue8, double? yvalue9, double? yvalue10)
{
this.Xvalue = xval;
this.YValue1 = yvalue;
this.YValue2 = yvalue2;
this.YValue3 = yvalue3;
this.YValue4 = yvalue4;
this.YValue5 = yvalue5;
this.YValue6 = yvalue6;
this.YValue7 = yvalue7;
this.YValue8 = yvalue8;
this.YValue9 = yvalue9;
this.YValue10 = yvalue10;
}
public ChartData(dynamic dynamic)
{
this.dynamic = dynamic;
}
public string Xvalue { get; set; }
public double YValue1 { get; set; }
public double YValue2 { get; set; }
public double? YValue3 { get; set; }
public double? YValue4 { get; set; }
public double? YValue5 { get; set; }
public double? YValue6 { get; set; }
public double? YValue7 { get; set; }
public double? YValue8 { get; set; }
public double? YValue9 { get; set; }
public double? YValue10 { get; set; }
}
and in the view
<div class="row">
<div class="col-xs-12 col-sm-12 col-md-12 text-center">
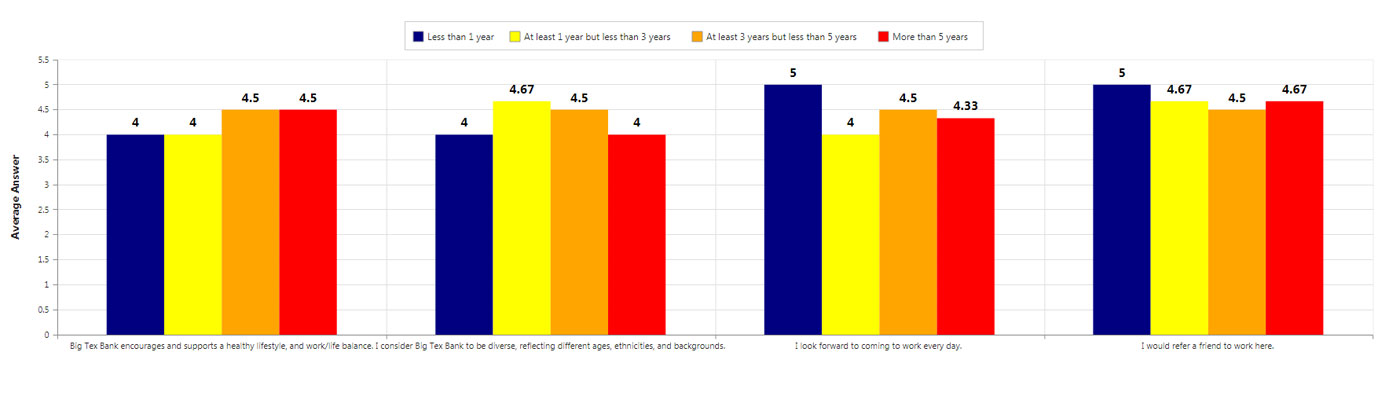
@(Html.EJ().Chart("chartContainer")
.PrimaryYAxis(px => px.Range(ra => ra.Max(5.5).Min(0).Interval(.5)).Title(tl => tl.Text("Average Answer").Font(ft => ft.FontWeight(ChartFontWeight.Bold))))
//.PrimaryXAxis(pr => pr.Title(tl => tl.Text("Question").Font(ft => ft.FontWeight(ChartFontWeight.Bold))))
.CommonSeriesOptions(cr => cr.Type(SeriesType.Column).EnableAnimation(true).Marker(mr => mr.DataLabel(dt => dt.Visible(true).TextPosition(TextPosition.Top).Font(fn => fn.Color("black").Size("16px").FontWeight(ChartFontWeight.Bold)))))
.Series(sr =>
{
sr.DataSource(ViewBag.Group1DataChart).XName("Xvalue").YName("YValue1").Fill("blue").Add();
sr.DataSource(ViewBag.Group1DataChart).XName("Xvalue").YName("YValue2").Fill("yellow").Add();
sr.DataSource(ViewBag.Group1DataChart).XName("Xvalue").YName("YValue3").Fill("orange").Add();
sr.DataSource(ViewBag.Group1DataChart).XName("Xvalue").YName("YValue4").Fill("red").Add();
})
.IsResponsive(true)
.Legend(lg => lg.Visible(true).Position(LegendPosition.Top).Border(br => br.Width(1).Color("#CCCCCC")).ItemStyle(itm => itm.Width(13).Height(13).Border(br => br.Width(1).Color("#999999"))))
)
</div>
</div>
which returns the following HTML
<div class="row">
<div class="col-xs-12 col-sm-12 col-md-12 text-center">
<div id="chartContainer" data-role="ejchart" data-ej-series='[{"fill":"blue","dataSource":ej.isJSON([{"Xvalue":null,"YValue1":0,"YValue2":0,"YValue3":null,"YValue4":null,"YValue5":null,"YValue6":null,"YValue7":null,"YValue8":null,"YValue9":null,"YValue10":null}]),"xName":"Xvalue","yName":"YValue1"},{"fill":"yellow","dataSource":ej.isJSON([{"Xvalue":null,"YValue1":0,"YValue2":0,"YValue3":null,"YValue4":null,"YValue5":null,"YValue6":null,"YValue7":null,"YValue8":null,"YValue9":null,"YValue10":null}]),"xName":"Xvalue","yName":"YValue2"},{"fill":"orange","dataSource":ej.isJSON([{"Xvalue":null,"YValue1":0,"YValue2":0,"YValue3":null,"YValue4":null,"YValue5":null,"YValue6":null,"YValue7":null,"YValue8":null,"YValue9":null,"YValue10":null}]),"xName":"Xvalue","yName":"YValue3"},{"fill":"red","dataSource":ej.isJSON([{"Xvalue":null,"YValue1":0,"YValue2":0,"YValue3":null,"YValue4":null,"YValue5":null,"YValue6":null,"YValue7":null,"YValue8":null,"YValue9":null,"YValue10":null}]),"xName":"Xvalue","yName":"YValue4"}]' data-ej-commonseriesoptions-type='column' data-ej-commonseriesoptions-enableanimation='true' data-ej-commonseriesoptions-marker-datalabel-visible='true' data-ej-commonseriesoptions-marker-datalabel-font-color='black' data-ej-commonseriesoptions-marker-datalabel-font-size='16px' data-ej-commonseriesoptions-marker-datalabel-font-fontweight='bold' data-ej-primaryxaxis-labelintersectaction='none' data-ej-primaryyaxis-orientation='vertical' data-ej-primaryyaxis-labelintersectaction='none' data-ej-primaryyaxis-title-text='Average Answer' data-ej-primaryyaxis-title-font-fontweight='bold' data-ej-primaryyaxis-range-min='0' data-ej-primaryyaxis-range-max='5.5' data-ej-primaryyaxis-range-interval='0.5' data-ej-isresponsive='true' data-ej-enable3d='false' data-ej-legend-border-color='#CCCCCC' data-ej-legend-border-width='1' data-ej-legend-position='top' data-ej-legend-itemstyle-height='13' data-ej-legend-itemstyle-width='13' data-ej-legend-itemstyle-border-color='#999999' data-ej-legend-itemstyle-border-width='1' ></div>
</div>
</div>
|
ASP.NET MVC:
string connectionString = null;
SqlDataAdapter adapter = new SqlDataAdapter();
DataSet dataset = new DataSet();
connectionString = @"Data Source=SYNCLAPN7430;Initial Catalog=chartDataSource;Integrated Security=True";
SqlConnection con = new SqlConnection(connectionString);
con.Open();
//Filter the data depend upon your requirement here
string command2 = "select * from chartData";
SqlCommand cmd1 = new SqlCommand(command2, con);
adapter.SelectCommand = cmd1;
//Stored the obtained data in dataset
adapter.Fill(dataset);
//Depends upon the length of data, stored the data in list
for (var i = 0; i < dataset.Tables[0].Rows.Count; i++)
{
string x1 = Convert.ToString(dataset.Tables[0].Rows[i].ItemArray[0]);
double y1 = Convert.ToDouble(dataset.Tables[0].Rows[i].ItemArray[1]);
double y2 = Convert.ToDouble(dataset.Tables[0].Rows[i].ItemArray[2]);
double y3 = Convert.ToDouble(dataset.Tables[0].Rows[i].ItemArray[3]);
double y4 = Convert.ToDouble(dataset.Tables[0].Rows[i].ItemArray[4]);
data.Add(new ChartData(x1, y1, y2, y3, y4));
}
//Returned data using viewbag to view page
ViewBag.dataSource = data;
|


Great!! Thank You!! I now have the chart being displayed properly except for the legend. Is there anyway to pass that information from controller instead of having to write as shown below in the View?
.Series(sr => sr.Name("") .Add();
BTW I have all of my Data in a DAL (makes reuseable as this will be called 12 times in the controller) and if anyone else wants to know how I made it work here is what I did
DAL
public DataSet PivotedGroupData(int GroupNumber, int SurveyNumber, int Demographic)
{
using (SqlConnection oConn = new SqlConnection(ConfigurationManager.ConnectionStrings["DefaultConnection"].ConnectionString))
{
using (SqlCommand oCmd = new SqlCommand())
{
DataSet ds = new DataSet();
oCmd.CommandText = "PivotedDemographicGroupAverage";
oCmd.CommandType = CommandType.StoredProcedure;
oCmd.Parameters.Add(new SqlParameter("@GroupID", GroupNumber));
oCmd.Parameters.Add(new SqlParameter("@Survey", SurveyNumber));
oCmd.Parameters.Add(new SqlParameter("@Demographic", Demographic));
oCmd.Connection = oConn;
oConn.Open();
SqlDataAdapter da = new SqlDataAdapter(oCmd);
da.Fill(ds);
return ds;
}
}
}
Controller
public ActionResult DemographicsReport(int SurveyNumber, int Demographic, SurveyDefinition survey)
{
\..
List<ChartData> data = new List<ChartData>();
DataSet ds = survey.PivotedGroupData(1, SurveyNumber, Demographic);
for (var i=0; i < ds.Tables[0].Rows.Count;i++)
{
string x1 = Convert.ToString(ds.Tables[0].Rows[i].ItemArray[0]);
double y1 = Convert.ToDouble(ds.Tables[0].Rows[i].ItemArray[1]);
double y2 = Convert.ToDouble(ds.Tables[0].Rows[i].ItemArray[2]);
double y3 = Convert.ToDouble(ds.Tables[0].Rows[i].ItemArray[3]);
double y4 = Convert.ToDouble(ds.Tables[0].Rows[i].ItemArray[4]);
data.Add(new ChartData(x1,y1,y2,y3,y4));
}
ViewBag.Group1DataChart = data;
\..
return View();
}
have been trying different things and decided to try the code below. It did put the title on the legend but i was not able to see the columns for the chart.
view
@{
int z = 0
string[] columnColors = new string[] { "#800080","#0000ff","#ffff00", "#ffa500","#ff0000","#c0c0c0","#d572fe","#d2b48c" ,"#000080", "#808000"};
string[] yvals = new string[] { "yvalue1", "yvalue2", "yvalue3", "yvalue4", "yvalue5", "yvalue6", "yvalue7", "yvalue8", "yvalue9", "yvalue10" };
}
@(Html.EJ().Chart("chartContainer")
.PrimaryYAxis(px => px.Range(ra => ra.Max(5.5).Min(0).Interval(.5)).Title(tl => tl.Text("Average Answer").Font(ft => ft.FontWeight(ChartFontWeight.Bold))))
//.PrimaryXAxis(pr => pr.Title(tl => tl.Text("Question").Font(ft => ft.FontWeight(ChartFontWeight.Bold))))
.CommonSeriesOptions(cr => cr.Type(SeriesType.Column).EnableAnimation(true).Marker(mr => mr.DataLabel(dt => dt.Visible(true).TextPosition(TextPosition.Top).Font(fn => fn.Color("black").Size("16px").FontWeight(ChartFontWeight.Bold)))))
.Series(sr =>
{
foreach(var rsp in ViewBag.ResponseList)
{
sr.DataSource(ViewBag.Group1DataChart).XName("Xvalue").YName(yvals[z]).Fill(columnColors[z]).Name(rsp.ResponseText).Add();
z ++;
}
})
.IsResponsive(true)
.Legend(lg => lg.Visible(true).Position(LegendPosition.Top).Border(br => br.Width(1).Color("#CCCCCC")).ItemStyle(itm => itm.Width(13).Height(13).Border(br => br.Width(1).Color("#999999"))))
)
I have attached the html source code perhaps you can see something I am not seeing.
this is the view code that does work but doe not tell me column names in legend
@(Html.EJ().Chart("chartContainer")
.PrimaryYAxis(px => px.Range(ra => ra.Max(5.5).Min(0).Interval(.5)).Title(tl => tl.Text("Average Answer").Font(ft => ft.FontWeight(ChartFontWeight.Bold))))
//.PrimaryXAxis(pr => pr.Title(tl => tl.Text("Question").Font(ft => ft.FontWeight(ChartFontWeight.Bold))))
.CommonSeriesOptions(cr => cr.Type(SeriesType.Column).EnableAnimation(true).Marker(mr => mr.DataLabel(dt => dt.Visible(true).TextPosition(TextPosition.Top).Font(fn => fn.Color("black").Size("16px").FontWeight(ChartFontWeight.Bold)))))
.Series(sr =>
{
sr.DataSource(ViewBag.Group1DataChart).XName("Xvalue").YName("YValue2").Fill("blue").Add();
sr.DataSource(ViewBag.Group1DataChart).XName("Xvalue").YName("YValue2").Fill("yellow").Add();
sr.DataSource(ViewBag.Group1DataChart).XName("Xvalue").YName("YValue3").Fill("orange").Add();
sr.DataSource(ViewBag.Group1DataChart).XName("Xvalue").YName("YValue4").Fill("red").Add();
})
.IsResponsive(true)
.Legend(lg => lg.Visible(true).Position(LegendPosition.Top).Border(br => br.Width(1).Color("#CCCCCC")).ItemStyle(itm => itm.Width(13).Height(13).Border(br => br.Width(1).Color("#999999"))))
)
Attachment: chartdata_82b052a3.zip
|
Queries |
Response | ||
|
Is there anyway to pass that information from controller instead of having to write as shown below in the View |
Yes, we can able to pass the series name from controller. We have prepared a sample, in which have passed series name from code behind and bind in the view page as depicted below.
You can change this with respect to your requirement. But from your query 2, we suspect that, you have already achieved this requirement.
| ||
|
It did put the title on the legend but i was not able to see the columns for the chart. |
From the provided code snippet, we found that you have mapped YName property with different variable, so chart is not rendered properly. Thus we suggest, to map the properties with the variable you have declared in code behind, so the chart is render properly.
Find the modified code snippet below:
Screenshot:
 |
Thank You!!
I have switched these to bar instead of column charts because some of the charts have as many as 10 series.
Once I did that and have all 11 charts loading, the legend is only showing on the very last chart for some reason. I need to correct that.
Also, I need to have it so the series are entered from top down not from bottom up. In this thread https://www.syncfusion.com/forums/130293/bar-chart-question you had told me how to reverse the dataSource. Is there another way to do this as this report has 11 charts on it that I need reversed. if it is not a simple solution I can change the order by in the SPROC
Attachment: files_9d8c0398.zip
|
Queries |
Response | |
|
all 11 charts loading, the legend is only showing on the very last chart for some reason. |
From your code snippet we found that for all the charts you have specified same id(chartContainer), so the reported scenario occurs. To overcome this you need to specify the chart with unique id, so that legends will be visible to all the charts.
| |
|
I need to have it so the series are entered from top down not from bottom up. |
By default our bar chart will render with bottom up approach. However your requirement can be achieved by specifying isInversed property of axis to true, so that chart will render as per your expectation(top down). Find the code snippet below.
Screenshot:
 |
- 10 Replies
- 2 Participants
-
MJ Miranda Johnson
- Jul 21, 2017 04:37 PM UTC
- Aug 1, 2017 01:35 PM UTC
