We use cookies to give you the best experience on our website. If you continue to browse, then you agree to our privacy policy and cookie policy. Image for the cookie policy date

load chart via Ajax.ActionLink

I have 3 Ajax.ActionLink links that should load the chart in the div based on order  default which is by group, Ascending and Descending  when I click on the link the chart is not visible.  However, I can view the html source when I have the console open and can see that the values are being rearranged.    If I put the javascript files in my partial view I can open the partial view up and see the chart there but it is not being displayed on the page i am calling it from.

Here is the code in the calling view 

<h2>Company wide average for each group</h2>
@Ajax.ActionLink("Default","GroupAverageChart",new { SurveyNumber = ViewBag.SurveyNumber, Sortby = 0  }, new AjaxOptions()
{
    HttpMethod = "GET", UpdateTargetId = "GroupChart", InsertionMode = InsertionMode.Replace
}) <span> | </span>
@Ajax.ActionLink("Ascending Average","GroupAverageChart",new { SurveyNumber = ViewBag.SurveyNumber, Sortby = 1  }, new AjaxOptions()
{
    HttpMethod = "GET", UpdateTargetId = "GroupChart", InsertionMode = InsertionMode.Replace
}) <span> | </span>
@Ajax.ActionLink("Descending Average","GroupAverageChart",new { SurveyNumber = ViewBag.SurveyNumber, Sortby = 2  }, new AjaxOptions()
{
    HttpMethod = "GET", UpdateTargetId = "GroupChart", InsertionMode = InsertionMode.Replace
}) 
<div class="row">
    <div class="col-xs-12 col-sm-12 col-md-12 text-center" id="GroupChart">
        @(Html.EJ().Chart("chart12Container")
              .PrimaryYAxis(pr => pr.Range(ra => ra.Max(5).Min(0).Interval(.5)).PlotOffset(24))
              .PrimaryXAxis(px => px.EnableTrim(true).MaximumLabelWidth(150))
              .CommonSeriesOptions(cr => cr.Type(SeriesType.Column).Marker(mr => mr.DataLabel(dt => dt.Visible(true).TextPosition(TextPosition.Top).Font(fn => fn.Color("black").Size("16px").FontWeight(ChartFontWeight.Bold)))))
              
              .Series(sr =>
              {
                  sr.DataSource(ViewBag.AllAvgChart)
                  .XName("GroupText").YName("AverageAnswer")
                  
                  .Add();
              })
              .PreRender("chartPreRender")
              .Palette(pl => { pl.Add("#008000"); })
              .IsResponsive(true)
              .Legend(lg => lg.Visible(false))

        )
    </div>
</div>

here is the partial view code 
@using Syncfusion.JavaScript.DataVisualization
@using Syncfusion.JavaScript

 @(Html.EJ().Chart("chart12Container")
              .PrimaryYAxis(pr => pr.Range(ra => ra.Max(5).Min(0).Interval(.5)).PlotOffset(24))
              .PrimaryXAxis(px => px.EnableTrim(true).MaximumLabelWidth(150))
              .CommonSeriesOptions(cr => cr.Type(SeriesType.Column).Marker(mr => mr.DataLabel(dt => dt.Visible(true).TextPosition(TextPosition.Top).Font(fn => fn.Color("black").Size("16px").FontWeight(ChartFontWeight.Bold)))))
              
              .Series(sr =>
              {
                  sr.DataSource(ViewBag.AllAvgChart)
                  .XName("GroupText").YName("AverageAnswer")
                  
                  .Add();
              })
              .PreRender("chartPreRender")
              .Load("getJsonData")
              .Palette(pl => { pl.Add("#008000"); })
              .IsResponsive(true)
              .Legend(lg => lg.Visible(false))

        )


and here is the controller code 

 public PartialViewResult GroupAverageChart(int SurveyNumber, int Sortby)
        {
            AllGroupAverages allAvg = new AllGroupAverages();
            allAvg.SurveyNumber = SurveyNumber;
            allAvg.SortOn = Sortby;
            List<AllGroupAverages_Result> aga = allAvg.GroupAverages();
            ViewBag.AllAvgChart = aga;

            return PartialView("GroupAverageChart");
        }


thanks for any help getting this to show in the calling page.  

7 Replies

DD Dharanidharan Dharmasivam Syncfusion Team July 14, 2017 01:36 PM UTC

Hi Miranda, 

Thanks for contacting Syncfusion support. 

We have analyzed your query. Your requirement of viewing chart can be achieved conditional statements in the view page and by redirecting to view page in ajax request. We have prepared a sample, in which in the ajax request we have redirected to view page and depends upon the data source we have rendered the chart. Initially we have rendered the empty chart and with respect ajax request we have updated data source You can change this with respect to your requirement. Find the code snippet below. 

ASP.NET MVC: 

View page: 
@if (ViewBag.AllAvgChart == null) 
{ 
    @(Html.EJ().Chart("chart12Container")) 
} 
else 
{ 
     //... 
} 

public ActionResult GroupAverageChart() 
        { 
            //... 
           return View("ChartFeatures"); 
        } 

Screenshot Ajax Request: 
 

Screenshot After Ajax Request: 
 

Sample for reference can be find from below link. 

If we have misunderstood your query, kindly revert us with more information on your query by modifying the attached sample, so that we can provide you the solution sooner. 

Dharani. 


MJ Miranda Johnson July 14, 2017 04:23 PM UTC

Your example has no AJAX.  It loads a new page.  It is supposed to just load a partial view result in the current page.  


I have included some images to show what i am meaning  

Pageload.jpg  shows the chart on the report inside the GroupChart div.  I have this opened in firebug so that i can show the HTML source on the page 

afterClick.jpg shows what I see on the page after I click on the Ascending link   notice that you cannot see the chart on the page.

after_ajax.jpg  shows the same view this time opened in firebug so that you can see the HTML source.   Notice how the source code is different than in Pageload.jpg  so the ajax call was successful it is just that the chart is not showing.

What-should-be-shown.jpg shows what i expected to see  (i pasted an image of the graph over the 1st one )  I am able to view the chart if i open the partial view GroupAverageChart if I add the javascript files  to it.  I even tried leaving them in and opening via an ajax call but no luck their either.  

So I am wondering why the chart is NOT visible in the GroupChart div after the ajax call


Attachment: ajax_1add97bb.zip


DD Dharanidharan Dharmasivam Syncfusion Team July 18, 2017 09:24 AM UTC

Hi Miranda, 
 
Thanks for your patience. 
 
We have analyzed your query with the provided screenshot. And we have prepared a sample with respect to your requirement. In the code behind, we have specified the chart properties and returned to the Ajax success event by serializing the chart model properties using the chart serialize and in the success event we have converted the serialized data to Json and then bind those properties to chart as highlighted in the below code snippet. Now the chart which is loaded in partial view will load in the home page(Where the ajax request is made). You can change this with respect to your scenario. Find the code snippet below. 
 
ASP.NET MVC: 

Controller: 
public ActionResult GroupAverageChart(Survey sur) 
        { 
            //Creating data source using list             
            List<ChartData> data = new List<ChartData>(); 
            data.Add(new ChartData(2005, 3)); 
            //... 
             
            //Specify the required chart properties  
            ChartProperties chartModel = new ChartProperties(); 
            Series ser = new Series(); 
            //... 
            chartModel.Series.Add(ser); 
            Chart chart = new Chart(); 
             
            //Serialized the chart model properties as highlighted below 
            return Json(chart.Serialize(chartModel), JsonRequestBehavior.AllowGet); 
        } 


@Ajax.ActionLink("Descending Average", "GroupAverageChart", new { SurveyNumber = 2, Sortby = 2 }, new AjaxOptions() 
{ 
    HttpMethod = "POST", 
    OnSuccess = "updateChart", 
}) 
 
function updateChart(data) { 
        var chartData = JSON.stringify(eval("(" + data + ")")); 
 
        //Converted the string to Json and bind the properties to chart 
        chartData = JSON.parse(chartData); 
        $("#GroupChart").ejChart(chartData) 
    } 

Screenshot: 
 

Sample for reference can be find from below link. 
 
If we have misunderstood your query at our end, kindly revert us by providing more information, which will be helpful in further analysis and provide you the solution sooner. 

Thanks, 
Dharani. 


MJ Miranda Johnson July 18, 2017 09:55 PM UTC

OK  I am getting very close.  Now I can see the chart  but for some reason on my page I also see a bunch of source code above the chart

Here is the controller

 public JsonResult GroupAJAXChart(int SurveyNumber, int Sortby)

        {

            AllGroupAverages allAvg = new AllGroupAverages();

            allAvg.SurveyNumber = SurveyNumber;

            allAvg.SortOn = Sortby;

            List<AllGroupAverages_Result> data = allAvg.GroupAverages();

            ChartProperties chartModel = new ChartProperties();

            Series ser = new Series();

            ser.Fill = "#008000";

            ser.DataSource = data;

            ser.XName = "GroupText";

            ser.YName = "AverageAnswer";

            chartModel.PrimaryYAxis.Range.Min = 0;

            chartModel.PrimaryYAxis.Range.Max = 5.5;

            chartModel.PrimaryYAxis.Range.Interval = 0.5;

            chartModel.PrimaryYAxis.PlotOffset = 24;

            chartModel.PrimaryYAxis.Title.Text = "Average Answer";

            chartModel.PrimaryXAxis.EnableTrim = true;

            chartModel.PrimaryXAxis.MaximumLabelWidth = 150;

            chartModel.PrimaryXAxis.Title.Text = "Group";

            chartModel.CommonSeriesOptions.Marker.DataLabel.Visible = true;

            chartModel.CommonSeriesOptions.Marker.DataLabel.Font.FontSize = "16px";

            chartModel.CommonSeriesOptions.Marker.DataLabel.Font.FontWeight = ChartFontWeight.Bold;

            chartModel.Legend.Visible = false;

            chartModel.PreRender = "chartPreRender";

            chartModel.Size.Height = "500px";

            chartModel.Series.Add(ser);

            Chart chart = new Chart();


            return Json(chart.Serialize(chartModel), JsonRequestBehavior.AllowGet);

        }


and here is the view that makes the ajax call

<br />

<h2>Company wide average for each group</h2>

@Ajax.ActionLink("Default","GroupAJAXChart",new { SurveyNumber = ViewBag.SurveyNumber, Sortby = 0  }, new AjaxOptions()

{

    HttpMethod = "GET",

    UpdateTargetId = "GroupChart",

    OnSuccess = "updateChart",

    InsertionMode = InsertionMode.Replace

}) <span> | </span>

@Ajax.ActionLink("Ascending Average", "GroupAJAXChart", new { SurveyNumber = ViewBag.SurveyNumber, Sortby = 1  }, new AjaxOptions()

{

    HttpMethod = "GET",

    UpdateTargetId = "GroupChart",

    OnSuccess = "updateChart",

    InsertionMode = InsertionMode.Replace

}) <span> | </span>

@Ajax.ActionLink("Descending Average", "GroupAJAXChart", new { SurveyNumber = ViewBag.SurveyNumber, Sortby = 2  }, new AjaxOptions()

{

    HttpMethod = "GET",

    UpdateTargetId = "GroupChart",

    OnSuccess = "updateChart",

    InsertionMode = InsertionMode.Replace

}) 

<div class="row">

    <div class="col-xs-12 col-sm-12 col-md-12 text-center" id="GroupChart">

        @(Html.EJ().Chart("chart12Container")

              .PrimaryYAxis(pr => pr.Range(ra => ra.Max(5).Min(0).Interval(.5)).PlotOffset(24))

              .PrimaryXAxis(px => px.EnableTrim(true).MaximumLabelWidth(100))

              .CommonSeriesOptions(cr => cr.Type(SeriesType.Column).Marker(mr => mr.DataLabel(dt => dt.Visible(true).TextPosition(TextPosition.Top).Font(fn => fn.Color("black").Size("16px").FontWeight(ChartFontWeight.Bold)))))


              .Series(sr =>

              {

                  sr.DataSource(ViewBag.AllAvgChart)

                  .XName("GroupText").YName("AverageAnswer")


                  .Add();

              })

              .PreRender("chartPreRender")

              .Palette(pl => { pl.Add("#008000"); })

              .IsResponsive(true)

              .Legend(lg => lg.Visible(false))


        )

    </div>

</div>

<br />

<br />

@section Scripts {

    @Scripts.Render("~/bundles/jqueryval")

<script src="~/Scripts/jquery.unobtrusive-ajax.min.js"></script>

    <script src="http://cdn.syncfusion.com/15.1.0.41/js/web/ej.web.all.min.js"></script>

    <script src="~/Scripts/ej/common/ej.unobtrusive.min.js"></script>

   <script type="text/javascript">

        function chartPreRender(sender) {

            var points = sender.model.series[0].points;

            for (var i = 0; i < points.length; i++) {

                var y = points[i].y;

                if (y < 1)

                    points[i].fill = "red";

                else if (y >= 1 && y < 2)

                    points[i].fill = "orange";

                else if (y >= 2 && y < 3)

                    points[i].fill = "yellow";

                else if (y >= 3 && y < 4)

                    points[i].fill = "#98FB98";

                else if (y >= 4 && y <= 5)

                    points[i].fill = "#006400";

            }

        }

        function updateChart(data) {

            var chartData = JSON.stringify(eval("(" + data + ")"));

            chartData = JSON.parse(chartData);

            $("#chart12Container").remove();

            $("#GroupChart").ejChart(chartData)

        }

        window.onload = function () {

            $("#chart12Container").ejChart({

                primaryXAxis :

                    {

                        title: { text:'Group'},

                        labelRotation : 45

                    },

                primaryYAxis : 

                    {

                        title:{ text: 'Average Answer'}

                    }

            });

        }

       </script>

}

 here is what it looks like before the ajax call  (I preload the default on the page)


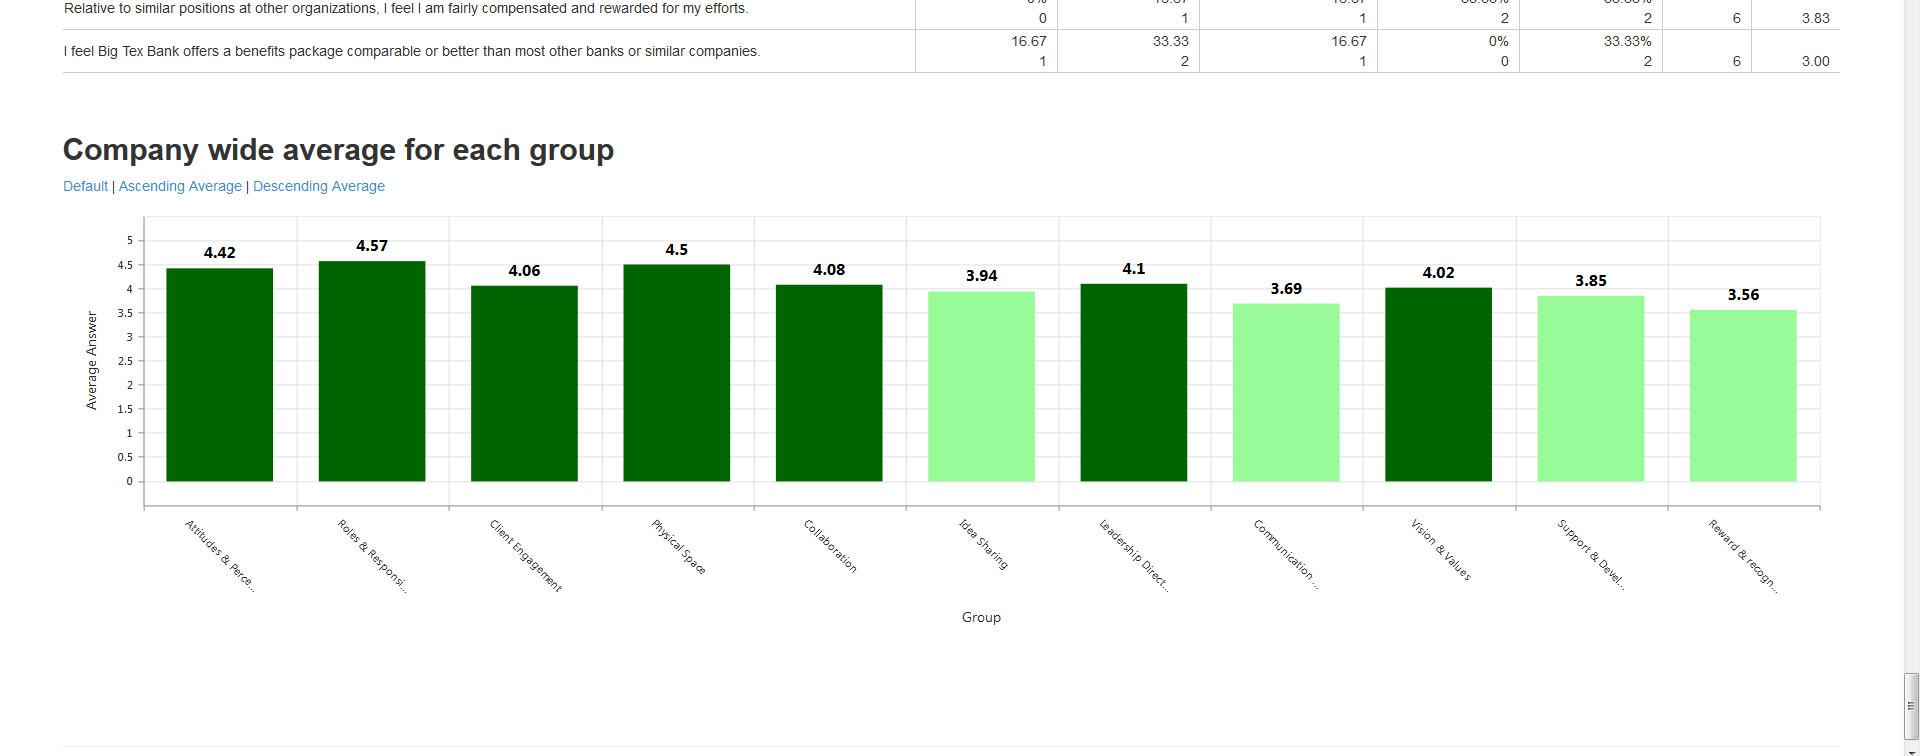
And here is what it shows now after I clicked on Ascending Average.  


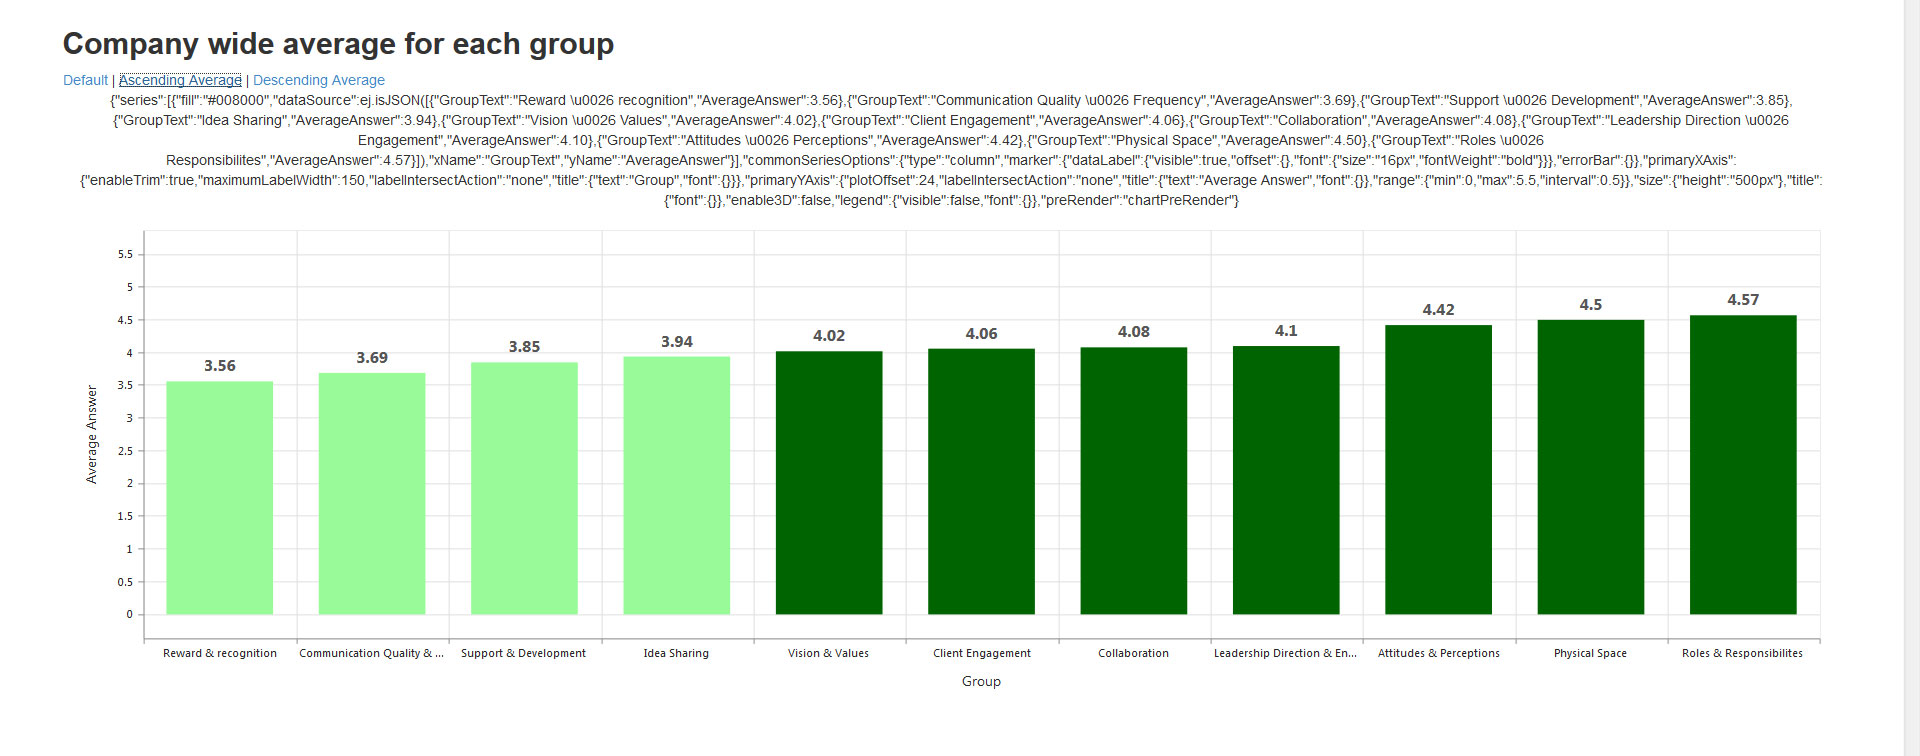
Except for my adding formatting I don't see any difference in what I have on the page vs what your sample displayed.  so why does mine show the html source code above the chart?    I tried it first as ActionResult as your example shows  and then switched to JsonResult to see if that made a difference.  It did not.  


DD Dharanidharan Dharmasivam Syncfusion Team July 19, 2017 06:28 AM UTC

Hi Miranda, 

Thanks for your update.  

We have analyzed your query. We would like to let you know that UpdateTargetId property is used to update the server response, in the specified element in DOM. From the provided code snippet, we found that you have used the UpdateTargetId property in the Ajax request, so after the response from the server, the returned properties were updated in the specified target id. Kindly remove the UpdateTargetId property, so that the chart properties(sample code) will not be visible. For more information on UpdateTargetId property, kindly follow the help document. Find the code snippet below to achieve this requirement. 
 
ASP.NET MVC: 
 
@Ajax.ActionLink("Default", "GroupAJAXChart", new { SurveyNumber = ViewBag.SurveyNumber, Sortby = 0 }, new AjaxOptions() 
{ 
    HttpMethod = "GET", 
    OnSuccess = "updateChart", 
}) 
 
 
Sample for reference can be find from below link. In the below sample we didn’t use the UpdateTargetId property. 
 
Kindly revert us, if you have any concern. 

Thanks, 
Dharani. 


MJ Miranda Johnson July 19, 2017 08:36 PM UTC

Thank you!!!   I know i have been a real pain


DD Dharanidharan Dharmasivam Syncfusion Team July 20, 2017 05:42 AM UTC

Hi Miranda, 
 
Thanks for your update. 

Kindly let us know, if you need any further assistance. 

Dharani. 


Loader.
Live Chat Icon For mobile
Up arrow icon