- Home
- Forum
- ASP.NET Web Forms
- Create charts dynamically base on user data
Create charts dynamically base on user data
Hello,
I am working on a ASP.NET web form project which need to create several charts by using data from CSV files,
Currently I don't know how to create charts dynamically using behind code (.cs code) instead of the <ej:Chart> tag predefined in the .aspx file.
For example, I have several CSV files (which I don't know exactly number of files beforehand because they are created by the end-user), like data1.csv, data2.csv...dataN.csv
I would like to plot N graphs from those data files automatically each time the web page loaded.
I've tried to search on the forum and KB for awhile but still not find the answer.
P/s: I don't want to use the multiple panes solution because the data format and scale are different so they should be separated to different graphs
SIGN IN To post a reply.
7 Replies
SK
Saravana Kumar Kanagavel
Syncfusion Team
May 3, 2017 11:16 AM UTC
Hi Trinh,
We have analyzed your query and created a sample based on your requirement. In the sample, we are dynamically creating the chart without using <ej:Chart> tag in ASPX page and we have bind the data from the CSV file to the chart.
Please find the code example below
|
[CS]
List<ChartData> list = new List<ChartData>();
using (var fs = File.OpenRead(path))
using (var reader = new StreamReader(fs))
{
while (!reader.EndOfStream)
{
var line = reader.ReadLine();
var values = line.Split(',');
list.Add(new ChartData(values[0], Convert.ToDouble(values[1])));
}
}
Syncfusion.JavaScript.Web.Chart chart = new Syncfusion.JavaScript.Web.Chart();
chart.PrimaryXAxis.ValueType = AxisValueType.Category;
Series series1 = new Series();
series1.XName = "Xvalue";
series1.YName = "YValue1";
chart.DataSource = list;
chart.DataBind();
chart.Size.Height = "450";
chart.Size.Width = "600";
chart.Model.Series.Add(series1);
holder.Controls.Add(chart); |
In the above code, we are getting the data from .csv file with specific path and binding that data to the chart series. Find the output of the sample below

And please find the data in .csv file from the below

We have attached the sample for your reference. And you can change this with respect to your requirement.
Please let us know if you have any concern.
Regards,
Saravana Kumar K
Regards,
Saravana Kumar K
TT
Trinh Thang Long
May 3, 2017 11:31 AM UTC
Excellent! This is exactly what I need, thank you very much for your quickly support!
SK
Saravana Kumar Kanagavel
Syncfusion Team
May 3, 2017 12:15 PM UTC
Hi Trinh,
Thanks for your update.
Please let us know if you need any further assistance on this.
Regards,
Saravana Kumar K.
MR
Mohamed Raffi Mansoor
August 17, 2019 06:04 AM UTC
[View]
<div class="row">
<div class="col-xs-12 col-sm-12 col-md-12">
<div class="row">
<div class="col-xs-12 col-sm-12 col-md-12">
<div class="col-xs-12 col-sm-12 col-md-12">
<div id="one" class="e-panel" data-row="0" data-col="0" data-sizeX="1" data-sizeY="1">
<ejs-chart id="container">
<e-chart-tooltipsettings enable="true">
</e-chart-tooltipsettings>
<e-chart-legendsettings visible="true"></e-chart-legendsettings>
<e-chart-primaryxaxis valueType="Category">
</e-chart-primaryxaxis>
<e-series-collection >
<e-series name="series1" xName="xValue" yName="yValue" dataSource="ViewBag.dataSource"
type="@Syncfusion.EJ2.Charts.ChartSeriesType.StackingColumn">
<e-series-marker>
<e-series-datalabel visible="true" position="Top"></e-series-datalabel>
</e-series-marker>
</e-series>
<e-series name="series1" xName="xValue" yName="yValue1" dataSource="ViewBag.dataSource"
type="@Syncfusion.EJ2.Charts.ChartSeriesType.StackingColumn">
<e-series-marker>
<e-series-datalabel visible="true" position="Top"></e-series-datalabel>
</e-series-marker>
</e-series>
</e-series-collection>
</ejs-chart>
</div>
</div>
</div>
</div>
</div>
</div>
[Controller]
List<ChartData> chartData = new List<ChartData>
{
new ChartData { xValue = "2014", yValue = 21, yValue1 = 21 },
new ChartData { xValue = "2015", yValue = 24, yValue1 = 31},
new ChartData { xValue = "2016", yValue = 36, yValue1 = 14 },
new ChartData { xValue = "2017", yValue = 38, yValue1 = 31 },
new ChartData { xValue = "2018", yValue = 54, yValue1 = 11 },
new ChartData { xValue = "2019", yValue = 57, yValue1 = 24 },
new ChartData { xValue = "2020", yValue = 70, yValue1 = 16 },
};
ViewBag.dataSource = chartData;
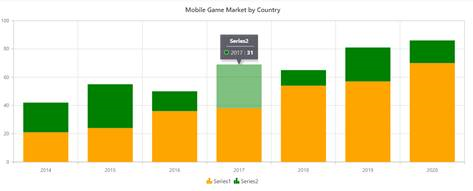
i have created stacked bar chart using ejs chart .
now i want to create series dynamically using controller can you please help me
KC
Kalaimathi Chellaiah
Syncfusion Team
August 20, 2019 12:10 PM UTC
Hi Mohamed,
Thanks for the update.
We have analysed your query. We have prepared a sample based on your requirement. In that we have created series in code behind and store it into the ViewBag. Then bind these collections into the chart series property. Now series is working fine as you expect. Please find below sample and code snippet,
Code Snippet:
[HomeController.cs]:
|
public IActionResult Index()
{
List<ChartSeries> collection = new List<ChartSeries>();
List<ChartData> chartData = new List<ChartData>
{
new ChartData { xValue = "2014", yValue = 21, yValue1 = 21 },
new ChartData { xValue = "2015", yValue = 24, yValue1 = 31},
new ChartData { xValue = "2016", yValue = 36, yValue1 = 14 },
new ChartData { xValue = "2017", yValue = 38, yValue1 = 31 },
new ChartData { xValue = "2018", yValue = 54, yValue1 = 11 },
new ChartData { xValue = "2019", yValue = 57, yValue1 = 24 },
new ChartData { xValue = "2020", yValue = 70, yValue1 = 16 },
};
ViewBag.dataSource = chartData;
ChartSeries series1 = new ChartSeries();
series1.XName = "xValue";
series1.YName = "yValue";
series1.DataSource = chartData;
series1.Fill = "orange";
series1.Name = "Series1";
series1.Type = Syncfusion.EJ2.Charts.ChartSeriesType.StackingColumn;
series1.Trendlines = new List<ChartTrendline>();
series1.Segments = new List<ChartSegment>();
series1.Visible = true;
ChartSeries series2 = new ChartSeries();
series2.XName = "xValue";
series2.YName = "yValue1";
series2.DataSource = chartData;
series2.Fill = "green";
series2.Name = "Series2";
series2.Type = Syncfusion.EJ2.Charts.ChartSeriesType.StackingColumn;
series2.Trendlines = new List<ChartTrendline>();
series2.Segments = new List<ChartSegment>();
series2.Visible = true;
collection.Add(series1);
collection.Add(series2);
ViewBag.series1 = collection;
return View();
}
public class ChartData
{
public string xValue;
public double yValue;
public double yValue1;
} |
[index.cshtml]:
|
<ejs-chart id="splineContainer" title="Mobile Game Market by Country" series=" ViewBag.series1">
<e-chart-primaryxaxis valueType="Category"/>
<e-chart-tooltipsettings enable="true"></e-chart-tooltipsettings>
<e-chart-legendsettings toggleVisibility="true"></e-chart-legendsettings>
</ejs-chart> |
Screenshot:
Please let me know if you have any queries.
Regards,
Kalai.
JP
Jia Pin
April 29, 2020 04:18 AM UTC
Hi Saravana Kumar Kanagavel,
Server Error in '/' Application.
Value cannot be null.
Description: An unhandled exception occurred during the execution of the current web request. Please review the stack trace for more information about the error and where it originated in the code.
Exception Details: System.ArgumentNullException: Value cannot be null.
Parameter name: key
Source Error:
Stack Trace:
Version Information: Microsoft .NET Framework Version:4.0.30319; ASP.NET Version:4.8.4075.0
I downloaded your sample and I am able to run it. But when I copy the sample code to my project, I keep getting error no matter how I tried to fix it for days. Below is the error, could you advise where did I do wrongly? Thank you.
Server Error in '/' Application.
Value cannot be null.
Parameter name: key
Description: An unhandled exception occurred during the execution of the current web request. Please review the stack trace for more information about the error and where it originated in the code.Exception Details: System.ArgumentNullException: Value cannot be null.
Parameter name: key
Source Error:
An unhandled exception was generated during the execution of the current web request. Information regarding the origin and location of the exception can be identified using the exception stack trace below. |
Stack Trace:
|
Version Information: Microsoft .NET Framework Version:4.0.30319; ASP.NET Version:4.8.4075.0
SM
Srihari Muthukaruppan
Syncfusion Team
April 30, 2020 09:42 AM UTC
Hi Jia,
We have analyzed your query. From that, we would like to let you know that we are unable to reproduce the reported issue. We have also tried to reproduce the issue on the latest version 18.1.46. Unfortunately, we are unable to reproduce the reported scenario. We have also attached the sample used for testing. Please find the below sample and screenshot.
Sample: https://www.syncfusion.com/downloads/support/directtrac/general/ze/DynamicData2027661271.zip
If you still face this issue. Please share the following information which will be more helpful for further analysis and provide you the solution sooner.
- Share the data source file used in your sample.
- Try to reproduce the reported scenario in the above sample
- Share the details if you have done any other customization in your sample.
Regards,
Srihari M
SIGN IN To post a reply.
- 7 Replies
- 6 Participants
-
TT Trinh Thang Long
- May 3, 2017 08:21 AM UTC
- Apr 30, 2020 09:42 AM UTC
