Can we set a fixed column width?
Hi guys,
If it is not too much to ask, in column/bar charts, is there any way to set a fixed column width, in pixels?
I am aware of columnWidth and columnSpacing, but this is different.
What to do if we want to show for instance stick bars, with columns always 3 pixels wide, regardless of the spacing between columns, chart's width, the number of points etc?
Best Regards,
Cristian
SIGN IN To post a reply.
3 Replies
DD
Dharanidharan Dharmasivam
Syncfusion Team
April 10, 2017 11:09 AM UTC
Hi Cristian ,
Thanks for contacting Syncfusion support.
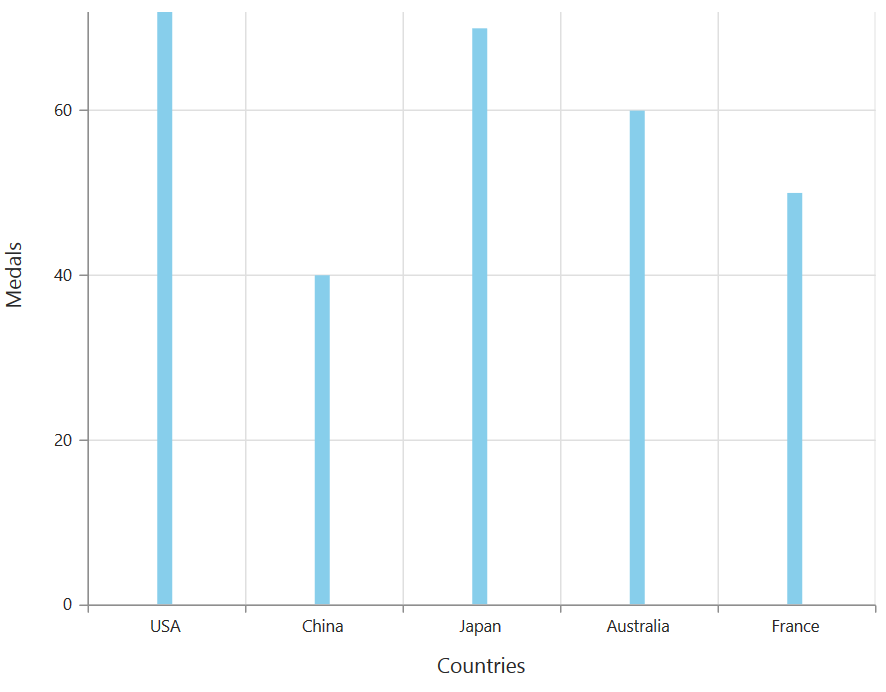
We have analyzed your query. Your requirement can be achieved as workaround using loaded event of chart. We have prepared a sample, in this we have specified column width as 10 pixel as highlighted in the below code snippet and you can change this with respect to your requirement. Thus the columns will always get render with 10px width even if there are more number of points or if there is change in width of the chart. Find the code snippet below.
| [JS] $("#container").ejChart( { //... loaded:"chartLoaded", }); function chartLoaded(sender) { var seriesElement = $("#container_svg_SeriesGroup_0"); var columnWidth = 10; for (var i = 0; i < seriesElement.children().length; i++) { var childElement = seriesElement.children()[i]; var id = childElement.getAttribute("id") if (childElement.tagName == "rect" && id.indexOf("Point") > -1) { var width = parseInt(childElement.getAttribute("width")); var x = parseInt(childElement.getAttribute("x")); childElement.setAttribute("width", columnWidth); childElement.setAttribute("x", x + (width / 2) - (columnWidth / 2)); } } } |
Screenshot:
Sample for reference can be find from below link.
Thanks,
Dharani.
CS
Cristian Scutaru
April 10, 2017 01:35 PM UTC
Brilliant hack as always :). Thanks, Dharani.
Just so you know, I also found in the meantime another simple way to do it, without a hack with the DOM, using a HiLo chart: http://jsfiddle.net/cristiscu/wwtn9vyo/3/
However, your solution could be more generic, because I'm not sure if mine can be used with horizontal bars as well.
Cheers and all the best,
Cristian
DD
Dharanidharan Dharmasivam
Syncfusion Team
April 11, 2017 09:32 AM UTC
Hi Cristian,
Thanks for your update.
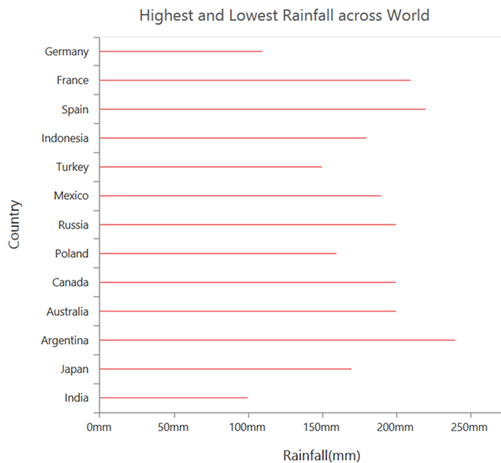
Yes, your requirement is also possible with hilo series type. And if you wish to render horizontal bars with hilo, it can be achieved by using isTransposed property in series. By specifying isTransposed property to true, the primaryXAxis will render vertically and this is applicable only with cartesian type series. Find the code snippet below.
| [JS] $("#container").ejChart({ //... series: [{ isTransposed:true, }], }); |
Screenshot:
Sample for reference can be find from below link.
And if you wish to change the width of the hilo bar, you need to specify the value to the width property in border. find the code snippet below.
| [JS] $("#container").ejChart({ //... series: [{ isTransposed:true, border: {width: 10} }], }); |
Sample for reference can be find from below link.
To render a hilo series type, you need to specify high and low values. In our example we have specified 0 as low value for all the points, to make it look as like bar chart.
And we suggest you to use the previously provided work around, which will be generic in all the cases.
Thanks,
Dharani.
SIGN IN To post a reply.
- 3 Replies
- 2 Participants
-
CS Cristian Scutaru
- Apr 7, 2017 05:12 PM UTC
- Apr 11, 2017 09:32 AM UTC
