Redraw not working
I was trying to use the redraw method on a chart using the api with jquery
$("#DataBindingChart").ejChart("redraw");
It wasn't working, but I was wondering what the way to do it in Angular 2 is?
SIGN IN To post a reply.
9 Replies
ZA
Zack
January 24, 2017 03:43 PM UTC
I've used ViewChild to get the chart and then I have looked for a redraw method but have been unable to find it. If this is the correct way to do it I just need to know where the redraw method is.
ZA
Zack
January 24, 2017 03:47 PM UTC
Like this
@ViewChild('grid') chart: any;
<ej-chart #grid>
Use this.grid to access it.
ZA
Zack
January 24, 2017 10:39 PM UTC
changed #grid to #chart for a better name
attempted to use
@ViewChild('chart') chart: any;
this.chart.widget.redraw();
was unable to get any results, I made sure to call it after view init, and I know I have the item because I can log it.
DD
Dharanidharan Dharmasivam
Syncfusion Team
January 25, 2017 01:32 PM UTC
Hi Zack,
Thanks for using Syncfusion product.
We have analyzed your query and prepared a sample with respect to your requirement. In this we have two data sets and in a button click we have changed the datasource and redrawn the chart. Kindly find the code snippet below to achieve this.
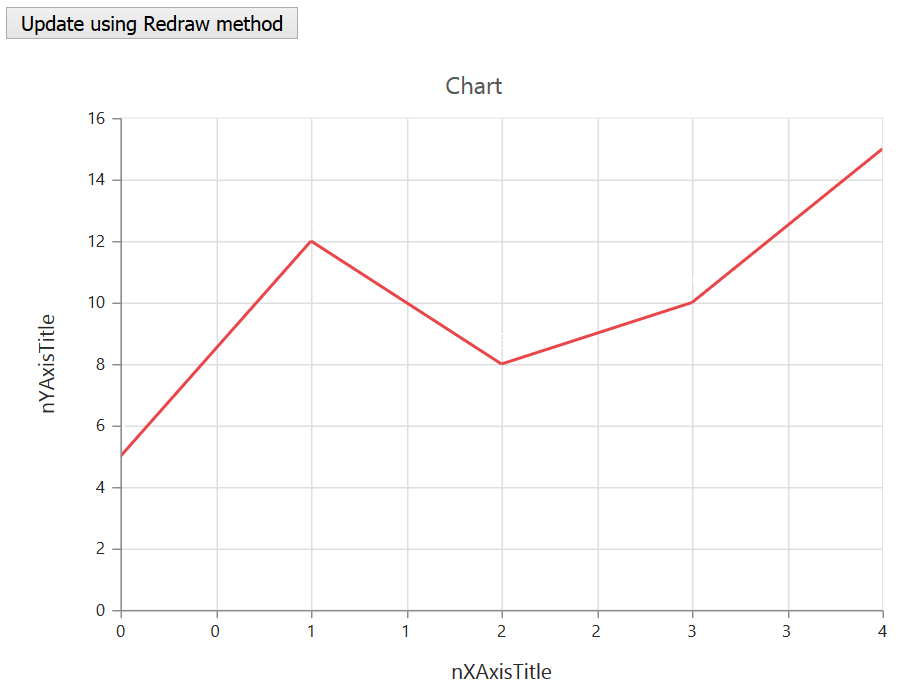
| Angular 2: <input type="button" onclick="UpdateChart()" value="Update using Redraw method" /> var data5 = [ { x: 0, y: 5 }, { x: 1, y: 12 }, { x: 2, y: 8 }, { x: 3, y: 10 }, { x: 4, y: 15 } ]; var data10 = [ { x: 0, y: 5 }, { x: 1, y: 12 }, { x: 2, y: 8 }, { x: 3, y: 10 }, { x: 4, y: 15 }, { x: 5, y: 5 }, { x: 6, y: 12 }, { x: 7, y: 8 }, { x: 8, y: 10 }, { x: 9, y: 15 }, ]; function UpdateChart() { //Get Chart instance var chart = $('#container').ejChart('instance'); //Change the data source chart.model.series[0].dataSource = chart.model.series[0].dataSource.length == 5 ? data10 : data5; //Redraw the chart $('#container').ejChart('redraw'); } |
Screenshot
For your reference we have attached the sample. Kindly find the sample from below location.
Sample Link: https://jsplayground.syncfusion.com/lgqb3l2v
Since the issue is not reproduced at our end, kindly revert us with your sample, so that we can analyze further and provide you the solution sooner.
Dharani.
ZA
Zack
January 25, 2017 02:37 PM UTC
I'm running into some errors and have some clarification
<ej-chart #chart>
<e-seriescollection>
<e-series type="polar" drawType="column" enableAnimation="true" [points]="data">
</e-series>
</e-seriescollection>
</ej-chart>
Chart is simple like this. Want to do something the Angular 2 way like this:
@ViewChild('chart') chart: any;
function(){
this.chart.widget.redraw();
}
When I tried to use the attached code I got some errors, when I logged the console.log($('#chart').ejChart('instance')); I got an empty array. I'm assuming this has something to do with the difference between div as a chart and actually using ej-chart. If there isn't a way to do this using Angular 2 ViewChild please advise and I'll switch to the div method with jQuery.
ZA
Zack
January 25, 2017 03:41 PM UTC
Also the sample was in Angular 1
DD
Dharanidharan Dharmasivam
Syncfusion Team
January 27, 2017 01:31 PM UTC
Hi Zack,
Thanks for you update.
We have analyzed your query. By using the below code snippet, you can able to redraw the chart. Need to specify as highlighted in code snippet.
| Angular 2: <ej-chart #contain id="container"></ej-chart> @ViewChild('contain') chart: any; ngAfterViewInit() { // After the view is initialized, chart will be available this.update(); } update() { this.chart.widget.redraw(); } |
For your reference we have attached the sample, kindly find the sample from below link.
Sample Link: https://www.syncfusion.com/downloads/support/directtrac/171539/ze/Chart_sample538442407
Dharani.
BS
Bernd Schuhmacher
March 4, 2017 05:59 PM UTC
Hi
I am trying to change a chart too. But with no luck so far.
With you demo given ( in which I could not see a change in the chart) I set up the following demo:
app.component.ts:
import { Component, ViewEncapsulation, ViewChild, Injectable } from '@angular/core';import { CommonModule } from "@angular/common";import { EJComponents } from './ej/core';import { EJ_CHART_COMPONENTS } from './ej/chart.component';declare let ej: any;@Component({selector: 'ej-app',templateUrl: 'app/app.component.html'})export class AppComponent {data1 = [{ x: 0, y: 5 }, { x: 1, y: 12 }, { x: 2, y: 8 }, { x: 3, y: 10 }, { x: 4, y: 15 }];data2 = [{ x: 0, y: 7 }, { x: 1, y: 2 }, { x: 2, y: 5 }, { x: 3, y: 14 }, { x: 4, y: 10 }];@ViewChild('Chart') Chart: any;private Tabelle1;constructor() {this.Tabelle1 = this.data1;}update() {this.Chart.widget.redraw();}changeChart() {if (this.Tabelle1 == this.data1) this.Tabelle1 = this.data2;else this.Tabelle1 = this.data1;console.log(this.Tabelle1);this.Chart.widget.redraw();}}
app.component.html:
<h2>Syncfusion Javascript Angular 2 Component</h2><ej-chart #Chart id="line" style="height: 320px; width: 420px; display:block;" [isResponsive]="true" [legend.visible]="true"primaryYAxis.title.text="y" primaryXAxis.title.text="x" ><e-seriescollection><e-series name="Front" fill=#1B93D0 [dataSource]="Tabelle1" xName="x" yName="y"></e-series></e-seriescollection></ej-chart><button (click)="changeChart()">changeData</button>
When the page loads I can see the data of the array data1.
I hoped to see data2 in the chart after clicking the Button.
The console Log shows the data i hoped to see in the chart.
Do you have any hints?
Regards
Bernd
DD
Dharanidharan Dharmasivam
Syncfusion Team
March 6, 2017 12:52 PM UTC
Hi Zack,
We have analyzed your query. Since the series property in chart is of type, array of objects and the dataSource property is also of type array of object, the one way binding can’t be implemented for this scenario. And this is a limitation. So, you need to assign the data source again to the chart series and then need to redraw the chart. Find the code snippet below.
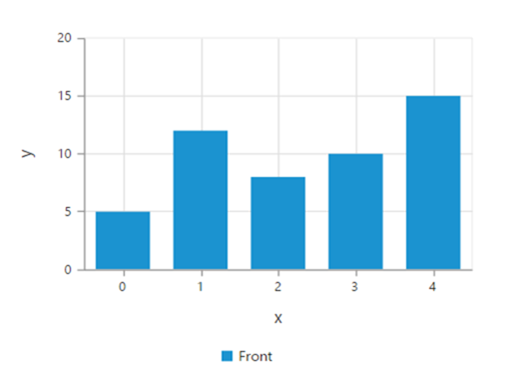
| Angular 2: <button (click)="changeChart()">changeData</button> changeChart() { this.Chart.widget.model.series[0].dataSource = this.data2; this.Chart.widget.redraw(); } |
Chart before updating the data:
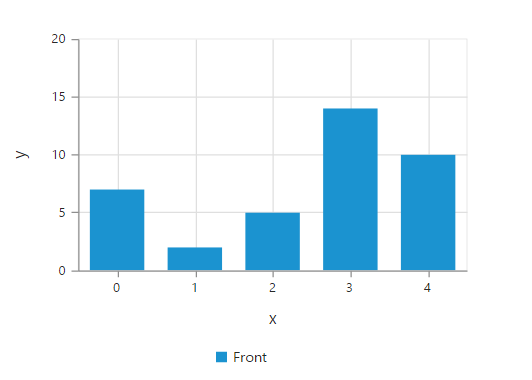
After updating the data:
Sample for reference can be find from below link.
The properties which support data binding are documented in the below link
Thanks,
Dharani.
SIGN IN To post a reply.
- 9 Replies
- 3 Participants
-
ZA Zack
- Jan 24, 2017 02:38 PM UTC
- Mar 6, 2017 12:52 PM UTC
