- Home
- Forum
- ASP.NET MVC
- Dynamically load series name and number of series in view
Dynamically load series name and number of series in view
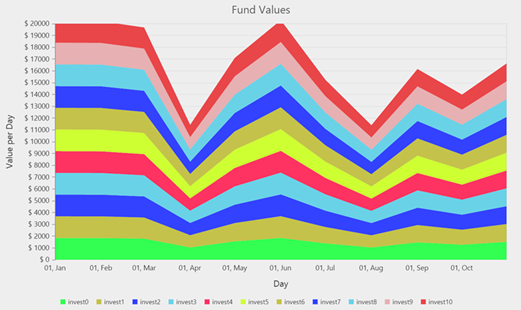
InvestmentName is not populating on chart. How can I dynamically load the number of series in the view by the number of series loaded in from Ajax, or is this possible?
@using Syncfusion.JavaScript.DataVisualization
@{
var srLength = ViewBag.jsonLength;
}
@Scripts.Render("~/Scripts/Index/Index.js")
<div>
@(Html.EJ().Chart("container")
.PrimaryXAxis(pr => pr.AxisLine(ax => ax.Visible(false)).MajorGridLines(mr => mr.Visible(false))
.MajorTickLines(mt => mt.Visible(false)).Title(tl => tl.Text("Day, Month"))
.Range(ra => ra.Min(new DateTime(2016, 4, 1)).Max(new DateTime(2016, 12, 31)).Interval(1)))
.PrimaryYAxis(pr => pr.Title(tl => tl.Text("Value per Day")).LabelFormat("$ {value}")
.Range(ra => ra.Min(0).Max(120000).Interval(5000)))
.Series(sr => {
//for (var i = 0; i < srLength; i++)
//{
// sr.Add();
//}
sr.Add();
sr.Add();
sr.Add();
sr.Add();
sr.Add();
sr.Add();
sr.Add();
sr.Add();
sr.Add();
sr.Add();
})
.IsResponsive(true)
.Load("getJsonData")
.Title(title => title.Text("Fund Values"))
.Size(sz => sz.Height("600"))
.Legend(lg => { lg.Visible(true); }))
</div>
<script type="text/javascript">
function getJsonData(sender) {
var colors = ["#33FF52", "#C4C24A", "#3342FF", "#69D2E7", "#FF3361"
, "#CEFF33", "#C4C24A", "#3342FF", "#69D2E7", "#E7B0B2"];
$.ajax({
type: "POST",
url: "Home/GetChartData",
async: false,
dataType: 'json',
success: function (data) {
for (var i = 0; i < data.length; i++) {
sender.model.series[i].dataSource = data[i].data;
sender.model.series[i].xName = "DateCreated";
sender.model.series[i].yName = "ValuePerDay";
sender.model.series[i].type = "StackingArea";
sender.model.series[i].opacity = .5;
sender.model.series[i].fill = colors[i];
sender.model.series[i].name = "InvestmentName";
}
},
});
}
$().ready(function () {
getJsonData();
});
</script>
public class JsonData
{
protected double m_Id = new double();
protected List<Data> m_data = new List<Data>();
public double Id { get { return m_Id; } set {m_Id = value; } }
public List<Data> data { get { return m_data; } set { m_data = value; } }
public JsonData(double Id, List<Data> data)
{
this.Id = Id;
this.data = data;
}
public JsonData(double po_ID, IEnumerable<TotalValuePerFundPerDay> po_model)
{
try
{
this.Id = po_ID;
//this.data = new List<Data>();
foreach (var item in po_model)
{
this.data.Add(new Data(item));
}
}
catch (Exception e)
{
throw e;
}
}
}
public class Data
{
public Data(DateTime DateCreated, decimal ValuePerDay, String InvestmentName)
{
this.DateCreated = DateCreated;
this.ValuePerDay = ValuePerDay;
this.InvestmentName = InvestmentName;
}
public Data(TotalValuePerFundPerDay po_model)
{
try
{
this.DateCreated = po_model.DateCreated;
this.ValuePerDay = po_model.ValuePerDay;
this.InvestmentName = po_model.InvestmentName;
}
catch (Exception e)
{
throw e;
}
}
public DateTime DateCreated { get; set; }
public decimal ValuePerDay { get; set; }
public String InvestmentName { get; set; }
}
SIGN IN To post a reply.
1 Reply
DD
Dharanidharan Dharmasivam
Syncfusion Team
November 10, 2016 11:08 AM UTC
Hi William,
Thanks for using Syncfusion product.
We have analyzed your query and created sample with respect to your requirement. In the ajax call itself, we can create the series for chart based on the data, initialize the series with empty object and then you can assign the property for series as mentioned in the below code snippet. And also you can populate the InvestmentName to chart as in the code snippet.
| ASP.NET MVC: @(Html.EJ().Chart("container") //... .Load("getJsonData") ) function getJsonData(sender) { var colors = ["#33FF52", "#C4C24A", "#3342FF", "#69D2E7", "#FF3361" , "#CEFF33", "#C4C24A", "#3342FF", "#69D2E7", "#E7B0B2"]; $.ajax({ type: "POST", url: '@Url.Action("chart","Home")', async: false, success: function (data) { for (var i = 0; i < data.length; i++) { sender.model.series[i] = {}; sender.model.series[i].dataSource = data; sender.model.series[i].xName = "xvalue"; sender.model.series[i].yName = "yvalue"; sender.model.series[i].fill = colors[i]; //Populating investname to chart sender.model.series[i].name = data[i].InvestmentName; } }, }); } |
Screenshot:
For your reference we have attached the sample. Kindly find the sample from below link,
Thanks,
Dharani.
SIGN IN To post a reply.
- 1 Reply
- 2 Participants
-
WV William Vickers
- Nov 9, 2016 08:26 PM UTC
- Nov 10, 2016 11:08 AM UTC
