Hi Daniel,
Thanks for using Syncfusion product.
We have analyzed your query. Since you have values for every five minutes for many months, you can use IntervalType as Months and also when the labels are overlapped, you can use LabelIntersectAction property. We have prepared sample with respect to your requirement. In the sample we have set Trim to LabelIntersectAction property, so that when the labels are overlapped, the labels will get trimmed. Kindly find the code snippet below,
Code snippet:
| Code snippet: //... .PrimaryXAxis(pr => pr .IntervalType(ChartIntervalType.Months) .LabelIntersectAction(LabelIntersectAction.Trim)) //... |
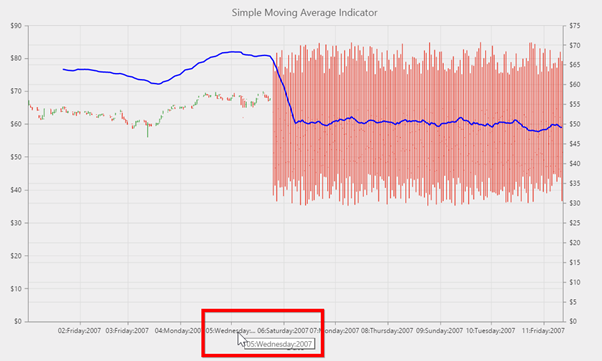
Screenshot:
For your reference we have attached the sample. Kindly find the sample from below link,
For more details on LabelIntersectAction property, follow the link below,
Also the labels can be rotated by using labelRotation property. More details on labelRotation property can be found from following link,
Thanks,
Dharani.