Data Markers number formating
I have problem to format decimal number in my Chart data markers.
My number is 34578.45 € and I want to format it like 345.78,45 €.
Want to put comma for thousands and dot for decimals.
I tried to do that in my dataSource when I prepared data for Chart, and for number 345.78,45 € chart cut of my decimal part and show just 345.78€.
Is there any way to do that, with some format function or template ?
Regards,
Milos
SIGN IN To post a reply.
5 Replies
SK
Saravana Kumar Kanagavel
Syncfusion Team
June 13, 2016 01:04 PM UTC
Hi Milos,
Thanks for contacting Syncfusion Support.
We have analyzed your query and created a sample based on your requirement. This requirement can be achieved by using “displayTextRendering” event.
Please follow the code example below
| [JS] function datalabelRendering(sender) { //displayTextRendering event triggered { var inputValue = sender.data.text; var format = "c"; var culture = Globalize.cultures.eu; var value = Globalize.format(inputValue,format,culture); var p = $("#euroSymbol")[0]; sender.data.text = value.replace(culture.numberFormat.currency.symbol,p.textContent); } |
In the above code, we are triggering “displayTextRendering” event . In the event, based on your culture[“eu-ES”] we have convert the normal number to currency value and assigning that value to the data label text.
And you can find the sample from the below location
Find the output of the sample below
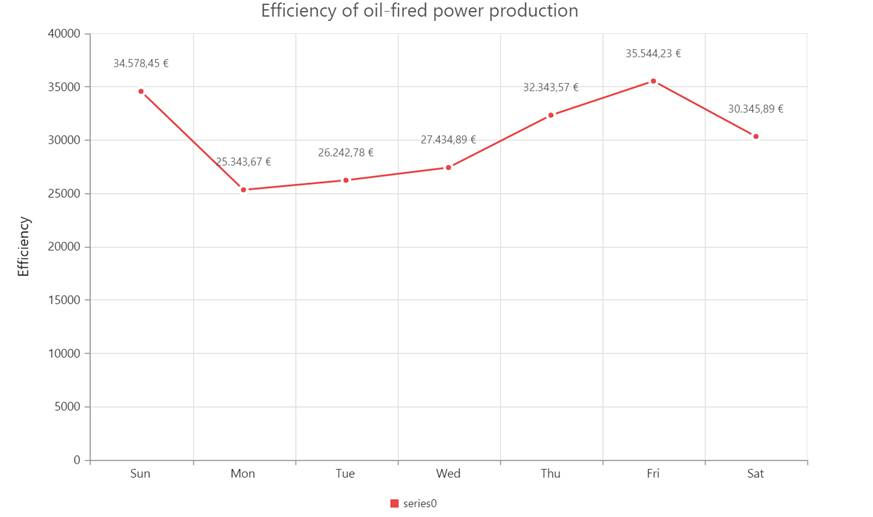
Please let us know if you have any concern.
Regards,
Saravana Kumar K.
MI
Milos
June 14, 2016 08:19 AM UTC
Hi Saravana,
I tried example and in my case it does not work, actually method for 'displayTextRendering' is never called.
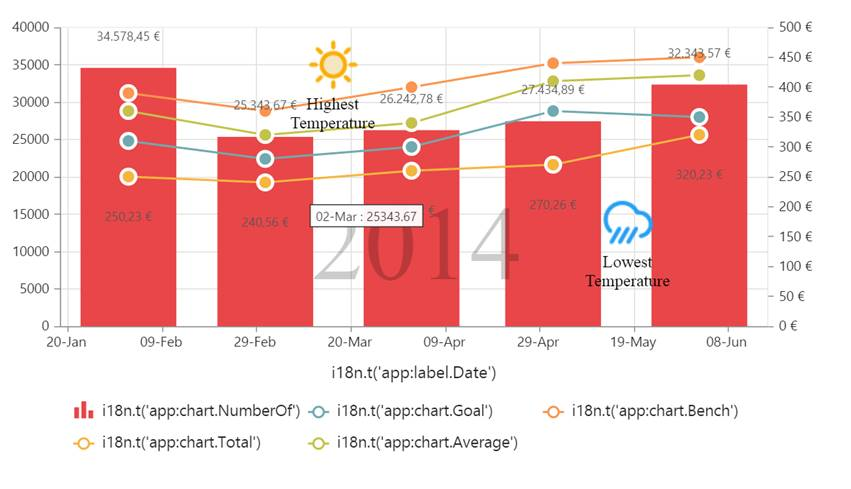
Below is my chart. Char is a bit complicated, contains couple of series.
Also, this kind of rendering applies to the all series, but I need that only on two series. For this case I noticed that we can approach 'seriesIndex' from method arguments and there I can decide for which series I want to apply which kind of textRendering.
But problem is that my method is never called ?
$("#chart").ejChart({
annotations: [
{ visible: true, content: 'water', opacity: 0.2 },
{ visible: true, content: 'low', coordinateUnit: 'points', x: 1, y: 51, verticalAlignment: 'top', margin: { bottom: 5 } },
{ visible: true, content: 'hight', coordinateUnit: 'points', x: 7, y: 97, verticalAlignment: 'top', margin: { bottom: 5 } }
],
primaryXAxis: {
rangePadding: 'Add',
title: { text: i18n.t('app:label.Date') },
range: { min: 0, max: 12, interval: axis.primaryAxis }
},
axes: [
{
majorGridLines: {
visible: false
},
orientation: 'Vertical',
range: { min: 0, interval: axis.secondaryAxis },
opposedPosition: true,
axisLine: { visible: false },
rangePadding: 'normal',
name: 'yAxis1',
labelFormat: '{value} €',
title: { text: '' }
}
],
commonSeriesOptions: {
enableAnimation: true,
tooltip: {
visible: true
}
},
series: [
{
name: i18n.t('app:chart.NumberOf'),
type: 'column',
enableAnimation: true,
dataSource: data,
xName: 'Date',
yName: 'CountOfOrders'
},
{
name: i18n.t('app:chart.Total'),
type: 'line',
enableAnimation: true,
marker:
{
shape: 'circle',
size: { height: 10, width: 10 },
visible: true
},
dataSource: data,
xName: 'Date',
yName: 'TotalRevenue',
yAxisName: 'yAxis1'
},
{
name: i18n.t('app:chart.Goal'),
type: 'line',
enableAnimation: true,
marker:
{
shape: 'circle',
size: { height: 10, width: 10 },
visible: true
},
dataSource: data,
xName: 'Date',
yName: 'GoalPerMonth',
yAxisName: 'yAxis1'
},
{
name: i18n.t('app:chart.Average'),
type: 'line',
enableAnimation: true,
marker:
{
shape: 'circle',
size: { height: 10, width: 10 },
visible: true
},
dataSource: data,
xName: 'Date',
yName: 'Average',
yAxisName: 'yAxis1'
},
{
name: i18n.t('app:chart.Bench'),
type: 'line',
enableAnimation: true,
marker:
{
shape: 'circle',
size: { height: 10, width: 10 },
visible: true
},
dataSource: data,
xName: 'Date',
yName: 'Bench',
yAxisName: 'yAxis1'
}
],
load: 'loadTheme',
displayTextRendering: function (args) {
var inputValue = sender.data.text;
var format = "c";
var culture = Globalize.cultures.eu;
var value = Globalize.format(inputValue, format, culture);
var p = $("#euroSymbol")[0];
sender.data.text = value.replace(culture.numberFormat.currency.symbol, p.textContent);
},
canResize: true,
legend: {
visible: true,
font: { size: '15px' },
shape: 'seriesType',
position: 'bottom',
itemStyle: { width: 15, height: 15 },
rowCount: 2
}
});
Regards,
Milos
SK
Saravana Kumar Kanagavel
Syncfusion Team
June 15, 2016 09:11 AM UTC
Hi Milos,
We have analyzed your query and modified a sample based on your requirement. In your code, we have found that you didn’t enable the data label so the data label event is not called. And also we would like to inform that if data label is enabled, then its event of “displayTextRendering” function will be called.
And also you can get the particular point value to convert the currency value from the below code snippet alternatively getting the “args.data.text” in the “displayTextRendering” event.
| [JS] displayTextRendering: function (args) { var inputValue = args.model.series[args.data.seriesIndex]._visiblePoints[args.data.pointIndex].y; }, |
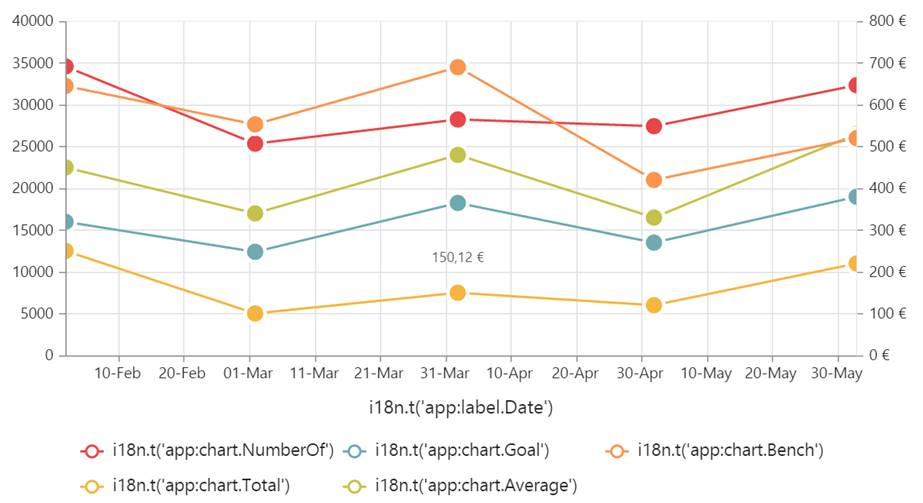
Please refer the modified sample from the below location
Please find the output of the sample:
Please let us know if you have any concern.
Regards,
Saravana Kumar K.
MI
Milos
June 15, 2016 11:35 AM UTC
Hi Saravana,
Thank you for your promt response.
Actually I do not want my label to be visible until I hover mark on Chart.
Is it possible ?
Best Regards,
Milos
SK
Saravana Kumar Kanagavel
Syncfusion Team
June 17, 2016 05:02 AM UTC
Hi Milos,
Thanks for your update.
We have analyzed your query and created a sample based on your requirement. And we have achieved your requirement through workaround.
Please refer the code example below:
| [JS] $(function () { $("#container").ejChart({ pointRegionMouseMove:function(args) // pointRegionMouseMove event triggered when hover on point { window.pointClick = true; }, chartMouseMove:function(args) //chartMouseMove event tiggered when move the mouse on chart area { var chart = $("#container").ejChart("instance"); //To get the chart instance if(window.pointClick){ for(var i=0;i<args.model.series.length;i++) { for(var j=0;j<args.model.series[i].points.length;j++) { var check ="container_svg_Series"+i+"_Point"+j+"_symbol"; if(args.data.id == check){ //checking that whether mouse hover on point var clearID = check; chart.model.series[i].points[j].marker.dataLabel.visible=true; window.flag =chart.model.series[i].points[j].marker.dataLabel.visible; window.seriesIndex = i; window.pointIndex = j; chart.redraw(); window.pointClick = false; } } } } if(args.data.id != clearID && window.flag) //To remove the datalabel when mouse move from the particular point { chart.model.series[window.seriesIndex].points[window.pointIndex ].marker.dataLabel.visible=false; chart.redraw(); } }, displayTextRendering: function (args) { //To covert the normal number to currency based on culture var inputValue = args.model.series[args.data.seriesIndex]._visiblePoints[args.data.pointIndex].y; var format = "c"; var culture = Globalize.cultures.eu; var value = Globalize.format(inputValue, format, culture); args.data.text = value; }, }); }); |
In the above code, we are triggering three events such as “pointRegionMouseMove”,” chartMouseMove” and “displayTextTendering”. By using “pointRegionMouseMove” event, we have declared the one variable to indicate as mouse hover on point for “chartMouseMove” event. On “chartMouseMove” event, we have find whether the mouse move on point in chart and If mouse move on point then we have specified “data label” as visible. And if mouse remove from the particular point after hover on point, then we have setting the visible as false to the data label. In the “displayTextRendering” event, we have convert the displaying data label number to currency value based on your culture.
And you can find the sample from the below location.
Please find the output of the sample below
Please let us know if you have any concern.
Regards,
Saravana Kumar K.
SIGN IN To post a reply.
- 5 Replies
- 2 Participants
-
MI Milos
- Jun 10, 2016 01:43 PM UTC
- Jun 17, 2016 05:02 AM UTC
