for pie chart show data lable in % value
hi
now connector line is coming for pie chart .
I want to show datalable with value in pecentage
if i have series like this.
tell me solution if any
Thanks
SIGN IN To post a reply.
3 Replies
SK
Saravana Kumar Kanagavel
Syncfusion Team
May 19, 2016 12:22 PM UTC
Hi Kalpa,
Thanks for contacting Syncfusion Support.
We have analyzed your query and created a sample based on your requirement. This can be achieved by “displayTextRendering” event.
Please follow the code example below
| [JS] $(function () { $("#container").ejChart( { displayTextRendering:"text" }); }); function text(sender) { //displayTextRendering event triggered sender.data.text = sender.data.text + "%"; } |
In the above code, we are triggering “diplayTextRendering” event. In the event, we are added the percentage with data label text.
We have also made a sample for your reference and attached in the below location.
Sample Link : https://www.syncfusion.com/downloads/support/directtrac/general/ze/Sample944793137-1592183596.zip
Find the output of the sample below
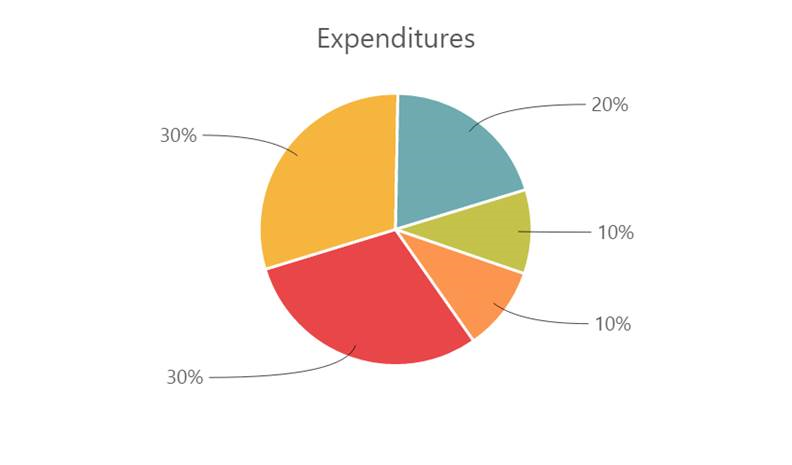
Please let us know if you have any concern.
Regards,
Saravana Kumar K
KS
kalpa serashiya
May 19, 2016 05:20 PM UTC
thanks
but i have to calculate % value according to y axis series value in pie chart
at time of rendering data label
SK
Sanjith Kesavan
Syncfusion Team
May 20, 2016 11:17 AM UTC
Hi Kalpa,
We have analyzed your query and modified the sample as per your requirement. In the sample, we have calculated total of all y-values given for the chart and from that total, we have calculated percentage for each y-values and assigned it to the point text. Please find the below code example.
| function text(sender) { if (total==0) { for (i = 0; i < sender.model.series[0].points.length; i++) { total = total + sender.model.series[0].points[i].y; } } sender.data.text = ((parseFloat(sender.data.text) / total) * 100).toFixed(2) + "%"; } |
In the above code, we have subscribed the “displayTextRendering” event and modified the datelabel text with the calculated percentage value. Please find the below screenshot of the chart.
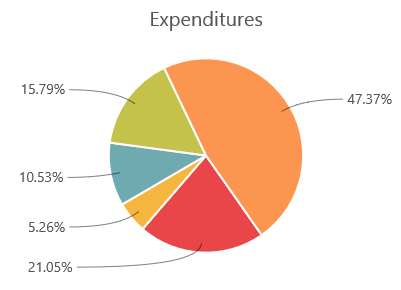
In the below link, we have attached the modified sample for your reference.
Sample link: https://jsplayground.syncfusion.com/byma10uh
Regards,
Sanjith.
SIGN IN To post a reply.
- 3 Replies
- 3 Participants
-
KS kalpa serashiya
- May 19, 2016 09:34 AM UTC
- May 20, 2016 11:17 AM UTC

