- Home
- Forum
- ASP.NET MVC (Classic)
- 100% stacked bar ej chart
100% stacked bar ej chart
Hi Rakhesh Rao,
Thanks for contacting Syncfusion support. We have prepared the sample for stackingbar100 series and in this sample you can change the datasource by changing dropdown. In the dropdown onchange event we have bound datasource for the series and redrawn the chart.
[JS]
function bindData(args) {
var chart = $("#container").ejChart("instance");
if (args.value == "1") {
chart.model.series[0].dataSource = data;
chart.model.series[0].xName = "XName";
chart.model.series[0].yName = "YName";
chart.model.series[1].dataSource = data;
chart.model.series[1].xName = "XName";
chart.model.series[1].yName = "YName1";
chart.redraw();
}
else {
chart.model.series[0].dataSource = data1;
chart.model.series[0].xName = "XName";
chart.model.series[0].yName = "YName";
chart.model.series[1].dataSource = data1;
chart.model.series[1].xName = "XName";
chart.model.series[1].yName = "YName1";
chart.redraw();
}
}
Above code is used to bind the data source to the chart. If the selected value is “1” then “data” is bound as datasource for the chart or else we have bound the “data1” as datasource for the chart. xName and yName contains corresponding x and y value for the chart. data and data1 is a JSON array and it contains the following values.
[JS]
var data = [
{ XName: 1, YName: 10, YName1: 5 },
{ XName: 2, YName: 20, YName1: 10 },
{ XName: 3, YName: 15, YName1: 7 },
{ XName: 4, YName: 10, YName1: 8 },
{ XName: 5, YName: 15, YName1: 10 }
]
var data1 = [
{ XName: 1, YName: 20, YName1: 15 },
{ XName: 2, YName: 10, YName1: 5 },
{ XName: 3, YName: 25, YName1: 20 },
{ XName: 4, YName: 5, YName1: 15 },
{ XName: 5, YName: 10, YName1: 10 }
]
While rendering the sample it renders like below.
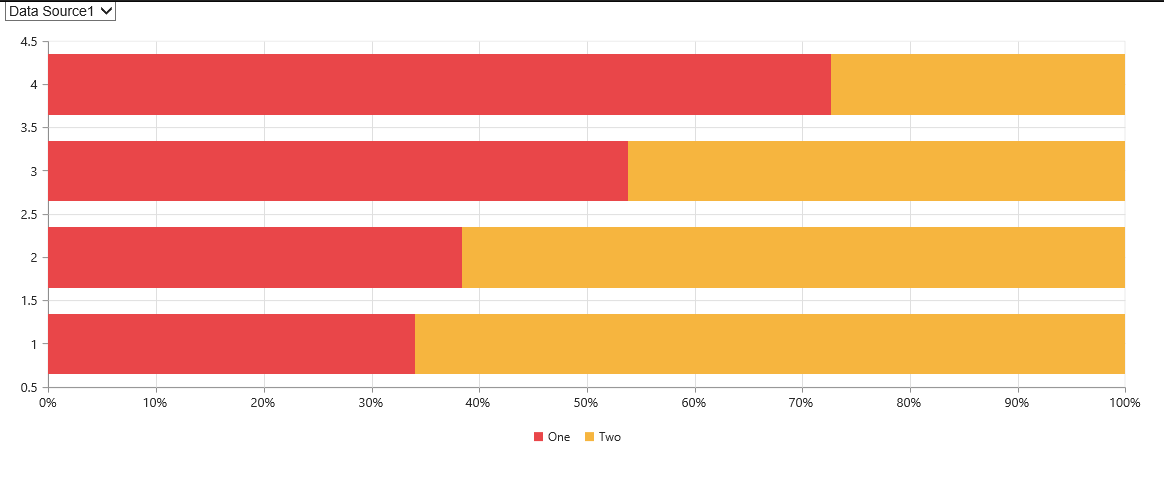
If we select the values in the dropdown, then new datasource will bind to the chart. Please find the below screenshot.
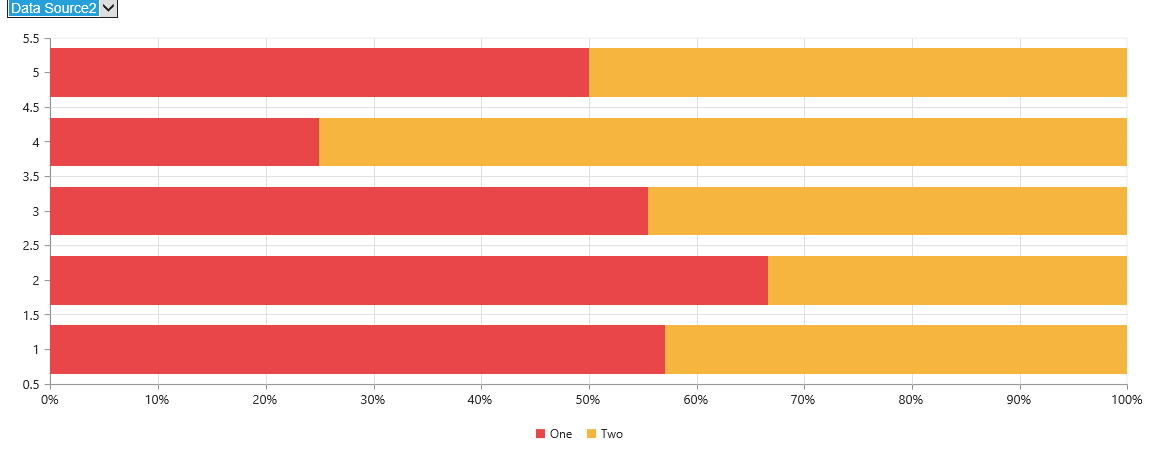
In the above screenshot, we have selected datasource 2. So data1 is bound as datasource for the chart and chart is redrawn as per the new data.
Please find the sample from below location.
Sample Link: https://www.syncfusion.com/downloads/support/forum/121839/ze/Stackingbar1559759475
While creating this forum, you have chosen ASP.NET MVC classic, but in your query you have asked about ej chart. We have attached the sample for ej chart. If this sample does not meet your requirement then please let us know.
Regards
Sanjith K.
Attachment: demo_1ad0090d.zip
We have gone through the code example provided by you in the attachment. Please find the response to your queries below.
Query1: .But i am trying to assigned dynamic data to data-source it throws an exception "Uncaught TypeError: Cannot set property 'dataSource' of undefined".
This kind of exception occurs if the series is not defined. You have to define the series before you bind the DataSource. Please find the below code example.

In the above code example, we have defined 4 series without giving any data. Now, you can add the data for the series. If you want to add DataSource for the 5th series, then define the series like above and bind the DataSource.
Query2: .How to bind dynamic data for ej chart series.
We can bind the dynamic data in a similar way of binding normal DataSource. Please find the below code example.
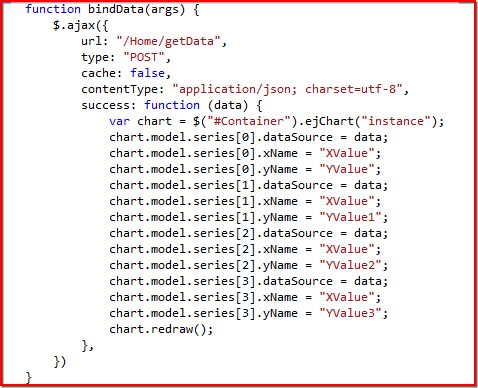
We have subscribed the “Onclick” event of the button and written the above code. In the above code, we have used Ajax postback to retrieve the data from the controller. In the controller, we have dynamically created the data and returned it to the view page. Please find the below code.
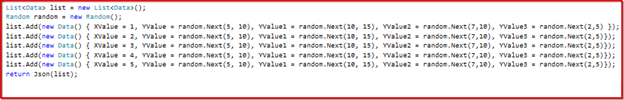
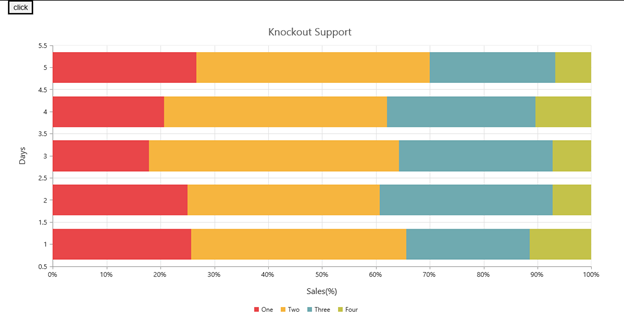
After binding the data, we have redrawn the chart. Now, it will render with the data, returned from the controller. Please find the below screenshots.
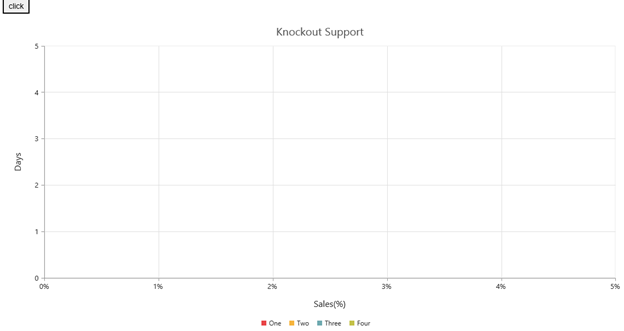
While running the sample without binding the DataSource:
After binding the DataSource:
We have prepared a sample using knockout.js. Please find the sample from: Sample Link: https://www.syncfusion.com/downloads/support/forum/121839/ze/Stackingbar11306554503
Regards,
Sanjith K.
Attachment: StackingBAr_5355674d.zip
Please find the response for your queries below.
Query1: How to set Height of Series for 100% Stacked bar chart
Currently, we do not have support for changing the height of the bar in the stacking bar chart. So, we have logged a feature request on this. For the better follow-up, we have created a branch incident under your account.
Query2: How to show legends in a circular shape. I have tried like this
Legend: { Visible: "true", Alignment: "Center", Position: "Bottom", Shape: "Circle", BorderWidth: "2" },
this is not working.
We have analyzed the above code example given by you. In the code example, you have given the first name of the every property in CAPS. Instead of this, please follow the below code.

For more details about legend please refer to: https://help.syncfusion.com/api/js/ejchart#members:legend
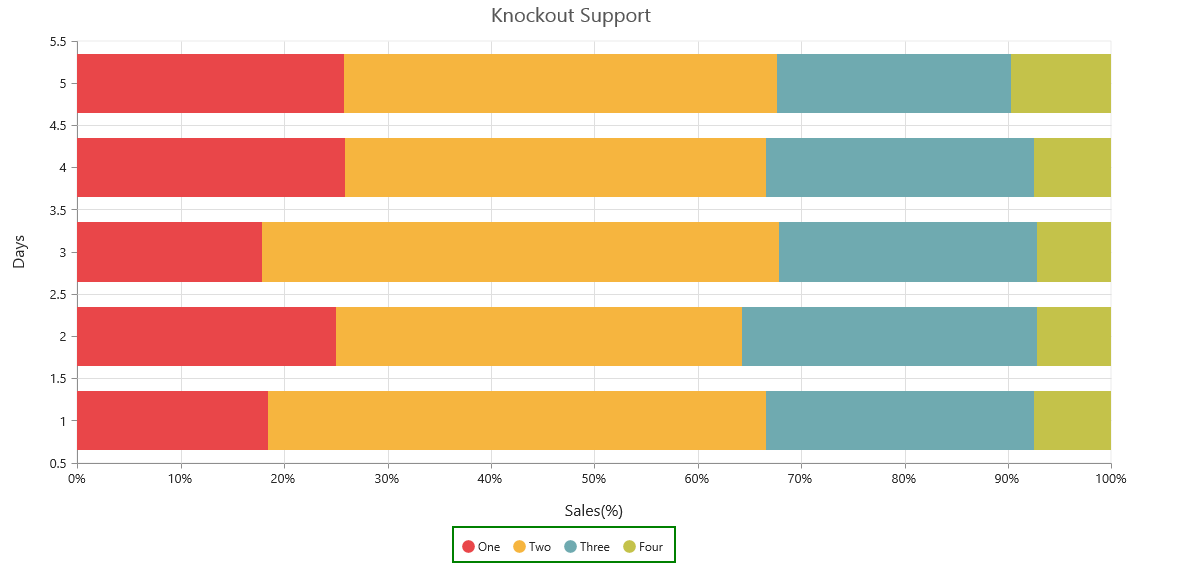
In the above code, we have set the legend shape as “circle” and set the border for the legend in green color. Now, the legend shape will be circle with green border for the legend. Please find the below screenshot.
We have prepared the sample as per your requirement. Please find the sample from below location.
Sample link: https://www.syncfusion.com/downloads/support/forum/121839/ze/stacking_bar-692691975
Regards,
Sanjith K.
- 6 Replies
- 2 Participants
-
RR Rakhesh Rao
- Jan 30, 2016 09:25 AM UTC
- Feb 5, 2016 09:26 AM UTC
