- Home
- Forum
- ASP.NET MVC
- Candle Chart.
Candle Chart.
Thanks for contacting Syncfusion support. We have analyzed your query. It is possible to bind the datasource for the candle chart. Please find the following code example.
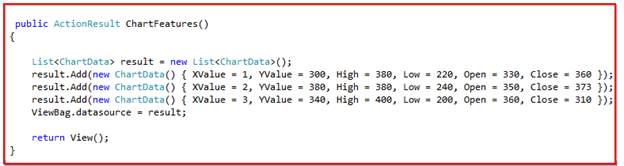
In the controller we have created the list and passed that list to the view page using the Viewbag. In the view page we have bound this data to the chart. Please find the below code example
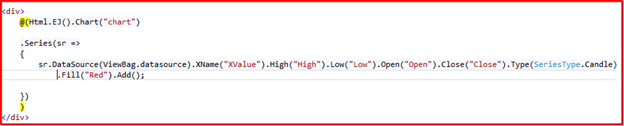
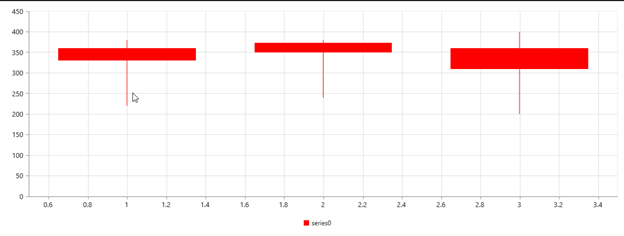
For binding the datasource to the candle chart please use the XName,High, Low, Open and Close builder values. Now the chart will render as per the data we are passing from the controller. Please find the below screenshot.
We have prepared the sample as per your requirement. Please find the sample from below location.
Sample Link: https://www.syncfusion.com/downloads/support/directtrac/general/ze/Candle167224762-1659380972.zip
Please let us know if you have any concern.
Regards,
Sanjith K.
Hi Andrea,
Thanks for your update.
We have analyzed your query (“The Marker helper is not defined and gives me Compilation errors on using data source in the series”) and checked with simple sample using datasource and markers in the series. But we couldn’t reproduce the above reported issue and the sample is working fine. Please find the code snippet.
[CSHTML]
@(Html.EJ().Chart("chartContainer")
//...
.Series(sr =>
{
//Adding Candle series
sr
.Marker(mr => mr
.Visible(true)
)
.XName("XValue")
.High("High")
.Low("Low")
.Open("Open")
.Close("Close")
.DataSource(ViewBag.datasource)
.Type(SeriesType.Candle)
.Add();
})
)
So could you please share your code snippet or sample which
will be helpful on resolving the issue and provide you the solution.
Let us know if you have any other concerns on this.
Thanks,
Bharathiraja.
- 3 Replies
- 3 Participants
-
AP Andrea Perazzolo
- Nov 27, 2015 07:54 AM UTC
- Dec 7, 2015 11:36 AM UTC
