- Home
- Forum
- ASP.NET Web Forms
- Efficient way to save & apply chart metadata?
Efficient way to save & apply chart metadata?
Hi Adham,
Thanks for contacting syncfusion support.
We have analyised your query.
We donot have any inbuilt method for saving and loading the chart from the database.
We have performed the required operation using AJAX PageMethods. PageMethods is a new mechanism in ASP.NET applications where the server code can be bound to ASP.NET pages. It is an easy way to communicate asynchronously with the server using ASP.NET AJAX technologies. It is an alternate to calling the page that is reliable and carries a low risk. It is basically used to expose the web methods to the client script.
Set EnablePageMethods=”true” in ScriptManger tag that allows to call a web page method directly from JavaScript.
Code Example:
[ASPX]
<asp:ScriptManager ID="ScriptManager1" runat="server" EnablePageMethods="true"></asp:ScriptManager>
The below code example illustrates how to save the chart to the database
Code example:
[JS]
function save() {
var chart = null;
var chart = $("#Chart1").ejChart("instance");
var saving = chart.model;
var stringify = String(JSON.stringify(saving));
PageMethods.save(stringify);
}
The following WebMethod is executed when the AJAX PageMethods call is made from client side. This method accepts the JSON string from client side and it is inserted in the database.
[ASPX.cs]
[WebMethod]
public static void save(string param1)
{
NorthWindDataContextDiagramEntities entities = new NorthWindDataContextDiagramEntities();
SaveDatabase gh = new SaveDatabase();
gh.Diagram2 =param1;
gh.Diagram3 = "dw";
entities.SaveDatabases.Add(gh);
entities.SaveChanges();
}
The below code illustrates how to load chart from the database
[JS]
function load() {
PageMethods.load(OnSuccess);
}
function OnSuccess(stringify) {
stringify = JSON.parse(stringify);
$("#Chart2").ejChart(stringify);
}
The following HttpPost is executed when the AJAX PageMethods call is made from client side. This method retrieves the JSON string from the database and send to client side.
ASPX.CS
[WebMethod]
String name, jsonstring;
public static string load()
{
NorthWindDataContextDiagramEntities entities = new NorthWindDataContextDiagramEntities();
entities = SqlCE;
List<SaveDatabase> loadJSON = entities.SaveDatabases.ToList<SaveDatabase>();
foreach (SaveDatabase data in loadJSON)
{
jsonstring = data.JSONString;
name = data.Name;
}
string loadcontent = jsonstring;
return loadcontent;
}
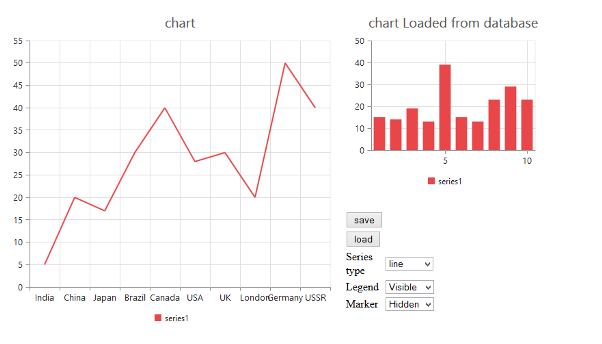
Screenshot :
Two Separate charts are loaded
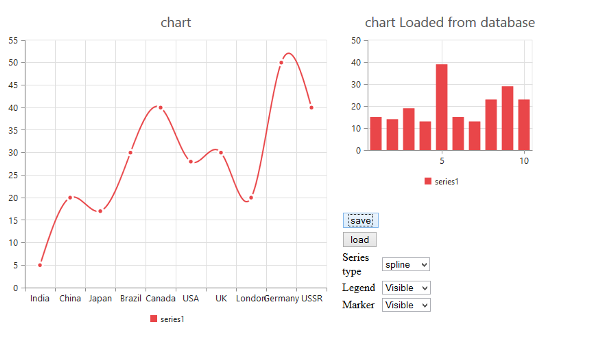
Now the series type is changed to spline and the marker is enabled and the chart is saved .
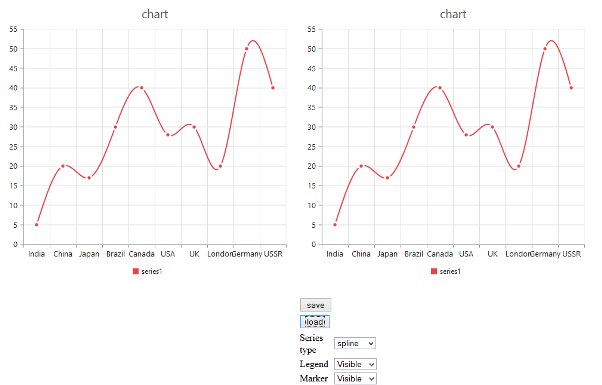
On clicking the load button the chart from the loaded database also is changed to spline
We have attched the sample for your reference
SampleLink:Chart_saving_and_loading_from_database
Please let us know if you have any concerns
Regards,
Deepaa.
- 1 Reply
- 2 Participants
-
AD Adham
- Nov 5, 2015 02:42 PM UTC
- Nov 6, 2015 12:05 PM UTC
