We use cookies to give you the best experience on our website. If you continue to browse, then you agree to our privacy policy and cookie policy. Image for the cookie policy date
close icon

Increase the interval line in chart

Hai ,

I want increase the interval line in chart,
For my chart the value is dynamically bind in run time . i not set max , min and  interval value. some time the max value goto 100000 that time the chart will show only 3 intervel line how to increse the interval value . kindly help me.

Thank you,
Vijayakumar.s

3 Replies

DP Deepaa Pragaasam Syncfusion Team October 26, 2015 08:32 AM UTC

Hi Vijayakumar,
Thanks for contacting Syncfusion Support.
We have analyised your query and replicated the scenario in our sample.
When the axis range is not set, the interval is calculated automatically based on the data given.
The number of intervals can be customized using the desiredIntervals property of the axis
Code Example:
[Deafult.aspx.cs]

            this.Chart1.PrimaryYAxis.DesiredIntervals = 5;


Screenshot:


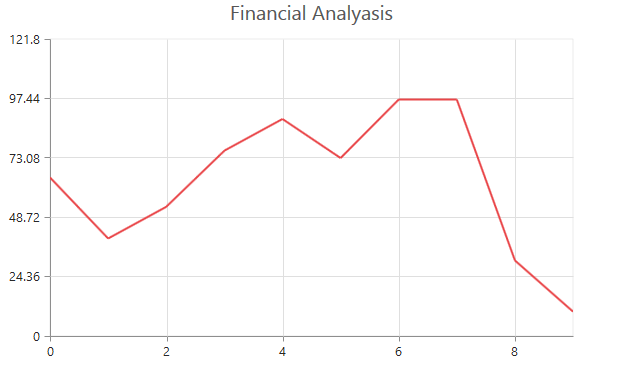
To know more about the desiredInterval please refer the below link
https://help.syncfusion.com/aspnet/chart/axis


We have attached sample for your reference. Find it from the below location

 https://www.syncfusion.com/downloads/support/forum/120885/ze/webApplication-1069197211

If you still face any concern, kindly revert back us by modifying the attached sample along with replication procedure.

This will be helpful for us to find and fix the issue sooner.


Please let us know if you have any concern.


Thanks,

Deepaa.


VI Vijaykumar October 26, 2015 12:32 PM UTC

hai Deepaa,

Thanks for updating working fine.

Thank you ,
Vijayakumar.S


PG Pon Geetha A J Syncfusion Team October 27, 2015 08:51 AM UTC

Hi Vijayakumar,
 
We are glad to know that your issue is resolved. Please get back to us if you need any further assistance.
 
Regards,
Geetha

Loader.
Live Chat Icon For mobile
Up arrow icon