- Home
- Forum
- ASP.NET MVC
- Render syncfusion chart control in partial view
Render syncfusion chart control in partial view
I've a partial view with syncfusion chart controls. When in main view, the user change values of dropdownlist, I want display the chart partial view.
My javascript code is:
<script type="text/javascript">
onRowSelected = function (args)
{
var id = args.data["ID"];
$.ajax({
type: 'GET',
url: "@Url.Content("/Informes/InformeSemanal/Chart")",
data: {
Id: id
},
dataType: "html",
success: function (result) {
$('#Details').html(result);
}
});
}
result has the html to render, but nothing is display
We have analyzed your query and prepared the sample as per your requirement.
In the sample we have created the dropdown in the main view and chart in the partial view.
Please find the below code snippet
[HTML]
<div>
Select DataSource:<select id="SelectDataSet" onchange="selectSource(this)" style="width:100px;height:20px">
<option value="SelectDataSet">5 points DataSet</option>
<option value="DataSet1">10 points DataSet</option>
</select>
</div>
[MVC]
@{
<div>
@(Html.EJ().Chart("chart").Series(sr =>
{
sr.DataSource(ViewBag.datasource).XName("XValue").YName("YValue").Add();
})
.Load("onchartload")
.PrimaryXAxis(xAxis => xAxis
.Font(font => font.Size("8px"))
.LabelIntersectAction(LabelIntersectAction.Trim))
.PrimaryYAxis(yAxis => yAxis.ValueType(AxisValueType.Double))
.EnableCanvasRendering(true)
.SeriesRendering("RenderSeries") //SeriesRendering event handler for chart.
.CanResize(true)
.Zooming(zn => zn.Enable(false).EnableMouseWheel(false))
)
</div>
}
Please find the below screen shot

In the partial view we have used ajax postback to add the datasource to the chart while clicking the dropdown in the main view.
Please find the below code snippet
[JS]
<script>
function selectSource(sender) {
var param = sender.selectedIndex == 0 ? 5 : 10;
$.ajax({
type: "POST",
url: "TreeGrid/Getjsondata",
data: { 'data': param },
async: false,
success: function (data) {
var chartObj = $("#chart").ejChart("instance");
chartObj.model.series[0].dataSource = data;
chartObj.redraw();
}
});
}
function RenderSeries() {
var chartObj = $("#chart").ejChart("instance");
chartObj.model.series[0].type = "column";
chartObj.model.series[0].name = "SeriesName Changed";
}
</script>
Screen shot

Please find the sample from the below location.
Sample link: https://www.syncfusion.com/downloads/support/forum/119918/ze/partial-423758284
Please let us know if you have any concerns.
Regards,
Sanjith K.?
Thanks for the update.
Please let us know if you have any further query on this.
Thanks,
Vinothkumar Arumugam.
if I had a dropdown with 5 values, then your code sample here will not work. i want to let user select chart type also.
var param = sender.selectedIndex == 0 ? 5 : 10;
and how can I append the the dropdown value to the
url: "TreeGrid/Getjsondata", // e.g. "TreeGrid/" +ddl.slecectedvaluetostring
do i need to destroy the chart and create a new instance, if the chart type changes.
do I need to use .render()
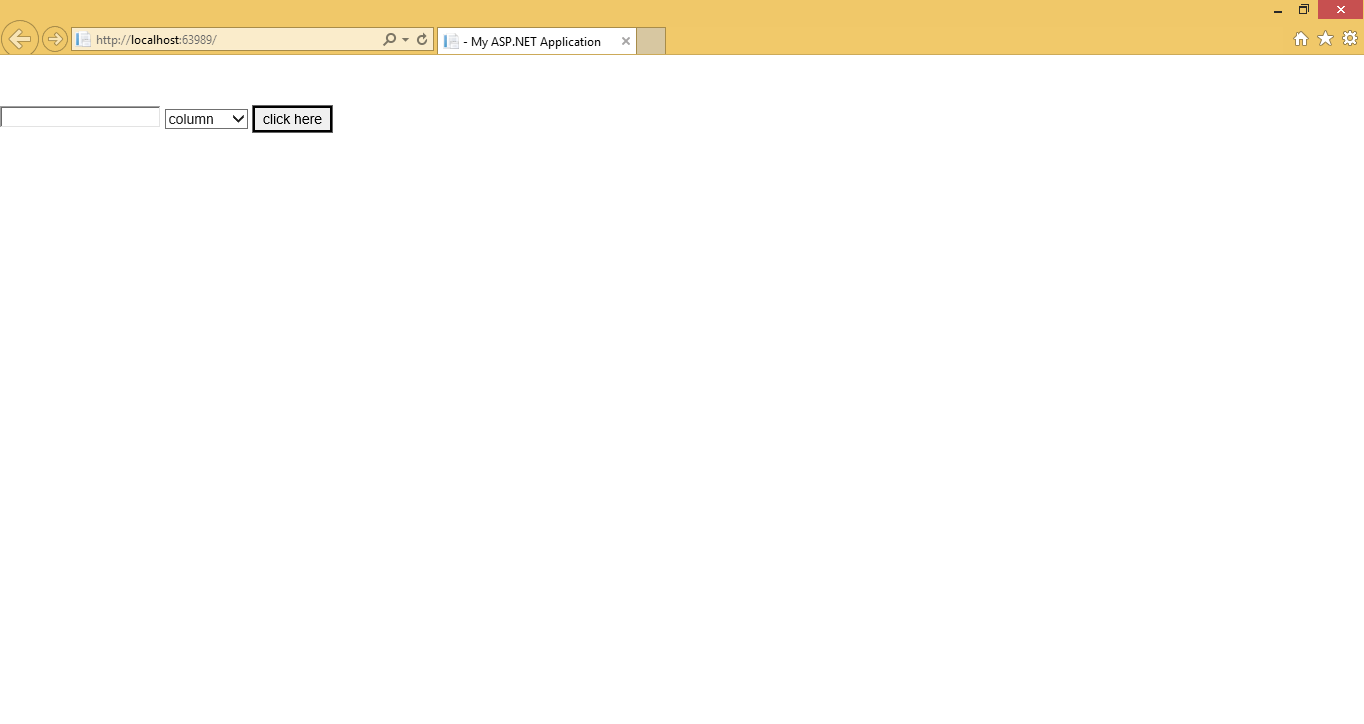
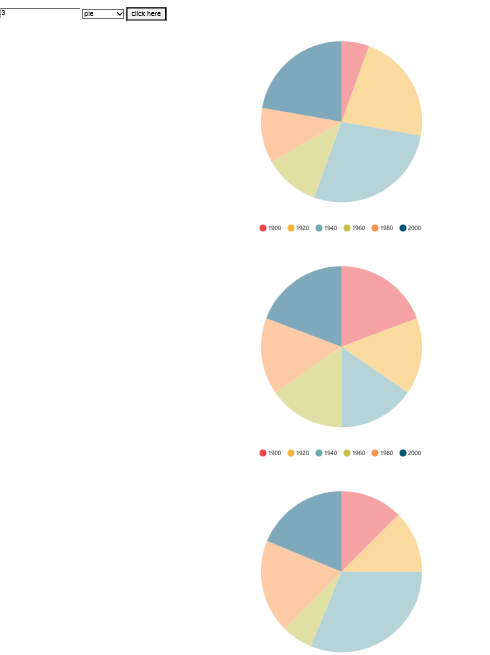
We have prepared the sample based on your requirement. While rendering the sample it will render like below.
In the textbox please enter the number of chart you want to render and in the dropdown please choose series type. For example we have entered chart count as 3 and type as pie. Now the sample will render like below.
Please find the sample from the below location.
Sample Link: https://www.syncfusion.com/downloads/support/forum/119918/ze/Chart1189703477
Query1: do i need to destroy the chart and create a new instance, if the chart type changes.
No need to destroy the chart while changing the series type. We have only removed the <div> and added the new <div> in the <body>.
Query2: do I need to use .render()
No need to use .Render(). It is already added in the layout page of the sample.
Please let us know if you have any concern.
Regards,
Sanjith K.
thanks
Sorry that the sample did not work. We have modified the sample as per your requirement. In the partial view, we have loaded the chart and added this partial view in the main view page using the following code.
[CSHTML]
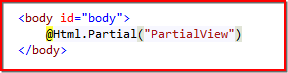
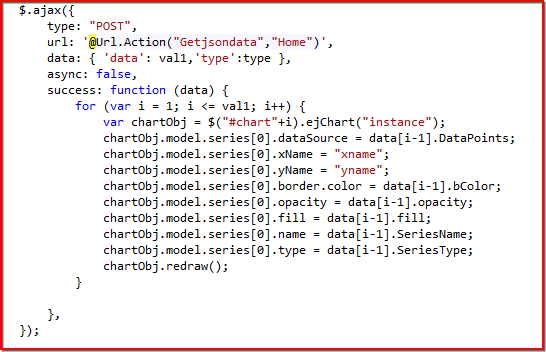
If the button is clicked, then the chart is created in the partial view and binds the data for the chart from the controller. For retrieving data from the controller, we have used Ajax post back. Please refer to the below code example.
Please find the sample from the below location.
Sample Link: https://www.syncfusion.com/downloads/support/forum/119918/ze/Chart205353191
Regards,
Sanjith K.
- Can you show me how to make it work and get the charts showing up inside a DIV with ID=Partial+ChartName (not the directly the body, but a row div)
- Also how to add/append the class/style information to the chart divs from the serverside/Action (then add the class information to the row div), for e.g. if its 3 charts, then 3 rows with responsive/resizing/auto height, both for the chart rendering and labels
Please add notes on the JS code.
thanks
We have analyzed your query and prepared sample based on you requirement. In the sample we have created the chart as per the number what we give. Please find the below code example
[JS]
| function renderChart() { var val1 = parseInt(document.getElementById("input").value); for (var i = 0; i < val1; i++) { $.ajax({ type: "POST", url: '@Url.Action("Getdata","Home")', data: { 'data': i }, async: false, success: function (data) { $("#home").html(data); }, }); }
} |
[C#]
| public ActionResult Getdata(int data) { return PartialView("PartialView",data); } |
Based on the number of chart, we have called the partial view and create chart with each div.
If this is not your requirement, then please give more detail regarding your query.
In the below link, we have attached sample for your reference.
Sample link: https://www.syncfusion.com/downloads/support/forum/119918/ze/Chart1724282814
And also could you please provide us below details?
This information would be helpful for us to provide the exact solution to meet your requirement.
Please let us know if you have any concern.
Regards,
Sanjith.
- 10 Replies
- 4 Participants
-
MA Manolo
- Aug 13, 2015 05:20 PM UTC
- Apr 12, 2016 01:12 PM UTC
