Beginner Question, But Driving Me Crazy - Setting Axis Labels?
Been trying to figure this out for hours, but with no progress, please help
How do I add text labels for the Axis when setting up a chart?
For example, if the first point should say "Joe" on the X axis, the second point should say "Jane", etc? I want to do it all through code as I will be creating these dynamically
Any help would be so much appreciated! Sorry for the newbie question, but just baffled
Thanks
Dim series As ChartSeries = Me.ChartControl1.Model.NewSeries("Series")
' Set the Text property of the series. This will be used by the legend. series.Text = series.Name
' Add points to the series.
series.Points.Add(1, 400)
series.Points.Add(2, 385)
series.Points.Add(3, 412)
series.Points.Add(4, 467)
series.Points.Add(5, 478)
series.Points.Add(6, 397)
series.Points.Add(7, 355)
series.Points.Add(8, 456)
series.Points.Add(9, 409)
' Set the type of Chart.
series.Type = ChartSeriesType.Line
' Add the series to the
Me.ChartControl1.Series.Add(series)
SIGN IN To post a reply.
5 Replies
VA
Vinothkumar Arumugam
Syncfusion Team
July 13, 2015 06:00 AM UTC
Hi Jeffrey,
We have analyzed this. You can achieve your requirements by using ChartFormatAxisLabel event. Which is used to customize the axis label when rendering the chart.
Following code snippets illustrate this.
Code Snippet [WF]:
We have analyzed this. You can achieve your requirements by using ChartFormatAxisLabel event. Which is used to customize the axis label when rendering the chart.
Following code snippets illustrate this.
Code Snippet [WF]:
· Declaring an event as below.

· When axis label rendered then ChartFormatAxislabel render event fired and perform below code. Which is customized the x-Axis label based on you needs.
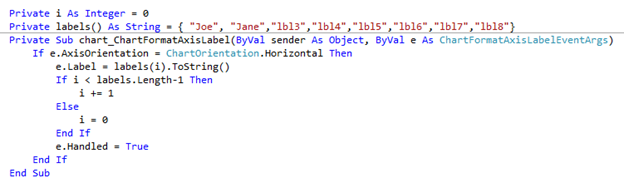
Screenshot:
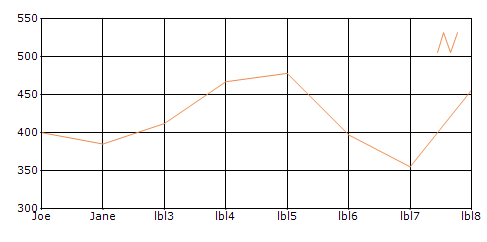
We have prepared a following sample. You can download it from below sample location.
Sample Location:
Chart_Axis_Label
Please let us know if you have any concern.
Thanks,
Vinothkumar Arumugam.
MH
Matthijs Huisman
November 28, 2016 01:19 PM UTC
Hi,
I have tried the the provided code with a PivotChart (line or stacked) by adding the eventhandler .ChartControl.ChartFormatAxisLabel. The event only fires for the vertical axis, but NOT for the horizontal axis.
I understand that my issue is a bit different: I have a PivotChart mapped to a datatable (PivotAxis added as New PivotItem with a FieldMappingName). Is there a way to customize the horizontal labels of a PivotChart similar to the example in the previous post?
Any help would be appreciated! Thanks a lot!
DD
Dharanidharan Dharmasivam
Syncfusion Team
November 29, 2016 11:40 AM UTC
Hi Jeffrey,
We have analyzed your scenario. In order to customize the X-axis labels in PivotChart, GroupingLabels[] property of ChartAxisGroupingLabelCollection of X-Axis can be used. Please make use of the below code,
Code example:
for (int i = 0; i < this.pivotChart1.ChartControl.PrimaryXAxis.GroupingLabels.Count; i++)
{
this.pivotChart1.ChartControl.PrimaryXAxis.GroupingLabels[i].Text = "lbl" + i;
}
Sample link:
Thanks,
Dharani.
MH
Matthijs Huisman
November 29, 2016 02:53 PM UTC
Hi Dharani,
your code works perfectly with my PivotChart! Thank you very much!
Cheers,
Matthijs
DD
Dharanidharan Dharmasivam
Syncfusion Team
November 30, 2016 08:51 AM UTC
Hi Jeffrey,
Thanks for your update.
Kindly revert us, if you need further assistance on this.
Dharani.
SIGN IN To post a reply.
- 5 Replies
- 4 Participants
-
JA Jeffrey Alexander
- Jul 12, 2015 01:09 AM UTC
- Nov 30, 2016 08:51 AM UTC
