how can i set X-axis text interval as per database input ?
Hi Kalpa,
Thanks for using Syncfusion product.
We have analyzed this. The below shows your x values
2014-02-01,
2014-02-05,
2014-02-09,
2014-02-11,
2014-02-17,
2014-02-20
Since these values have an irregular interval, we cannot use data time axis to display these exact values in chart.
This is because the data time axis is of linear type, it will be rendered such that axis range will be calculated based on minimum and maximum values of data points. The number of intervals in axis will be calculated based on range and axis size. Labels will be created for the intervals in specified format rather than data points. Refer Datetime Axis for more information about date time axis in Chart.
Hence If you use date time axis, labels are rendered based on the regular intervals.
To render labels with irregular interval you can use category axis. The below code snippet shows this.
[JS] $("#container").ejChart( { //Initializing Primary X Axis primaryXAxis: { labelFormat : "yyyy-MM-dd", valueType: 'category' }, //Initializing Series series: [ { points: [{ x: new Date(2014, 02, 01), y: 10 }, { x: new Date(2014, 02, 05), y: 30 }, { x: new Date(2014, 02, 09), y: 15 }, { x: new Date(2014, 02, 11), y: 65 }, { x: new Date(2014, 02, 17), y: 90 }, { x: new Date(2014, 02, 20), y: 85 }], } ] }); |
And in addition you can also specify the values like this
[JS] $("#container").ejChart( { //Initializing Primary X Axis primaryXAxis: { valueType: 'category' }, //Initializing Series series: [ { points: [{ x: "2014-02-01", y: 10 }, { x: "2014-02-05", y: 30 }, { x: "2014-02-09", y: 15 }, { x: "2014-02-11", y: 65 }, { x: "2014-02-17", y: 90 }, { x: "2014-02-20", y: 85 }] } ] }); |
We have also made a sample to illustrate this. Find it from the below location
datetime.zip
The below shows the output of the attached sample
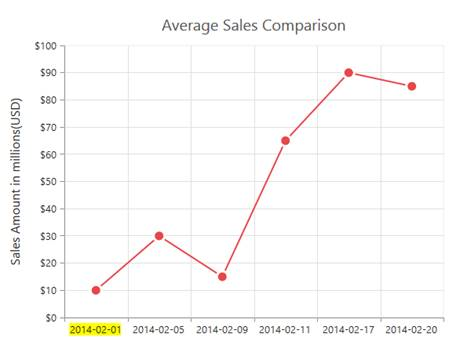
Please let us know if you have any concern.
Thanks,
Jayavigneshwaran
Currently there is no support to use range navigator with chart which is of category type. We have logged this as a feature request in our database. We will implement this feature in any of our upcoming releases.
Please let us know if you have any concern.
Thanks,
Jayavigneshwaran
- 4 Replies
- 2 Participants
-
KS kalpa serashiya
- Mar 30, 2015 05:22 AM UTC
- Apr 1, 2015 01:10 PM UTC
