We use cookies to give you the best experience on our website. If you continue to browse, then you agree to our privacy policy and cookie policy. Image for the cookie policy date

Resizing page when CanResize & EnableCanvasRendering are true

Hi,
When i have a chart with CanResize(true) and EnableCanvasRendering(true), when i resize the page the chart disappears. Are these combinations allowed, and is there someway to overcome this disappearance.
                        @(Html.EJ().Chart(@chartData.ChartName)
                          .Series(sr =>
                          {
                              foreach (var series in @chartData.SeriesCollection)
                              {
                                  sr.Name(series.SeriesName)
                                      .Type(SeriesType.Line)
                                      .DataSource(series.DataPointCollection)
                                      .XName("Date")
                                      .YName("Value")
                                      .Add();
                              }
                          })
                          .PrimaryXAxis(xAxis => xAxis.ValueType(AxisValueType.Datetime)
                              .LabelFormat("HH:mm:ss dd/MM/yyyy")
                              .Font(font => font.Size("8px"))
                              .LabelIntersectAction(LabelIntersectAction.Rotate45)
                              .IntervalType(ChartIntervalType.Minutes))
                          .PrimaryYAxis(yAxis => yAxis.ValueType(AxisValueType.Double))
                          .EnableCanvasRendering(true)
                          .CanResize(true)

                        )

See attached file.

Rob 

Attachment: Syncfusion_Chart_Image_8b59b746.zip

3 Replies

JA Jayavigneshwaran Syncfusion Team March 24, 2015 08:23 AM UTC

Hi Rob,

Thanks for using Syncfusion product.

We have analyzed this and replicated the scenario shown in screen shot in our sample, but we are not able to reproduce the reported issue.

The below screen shot shows this

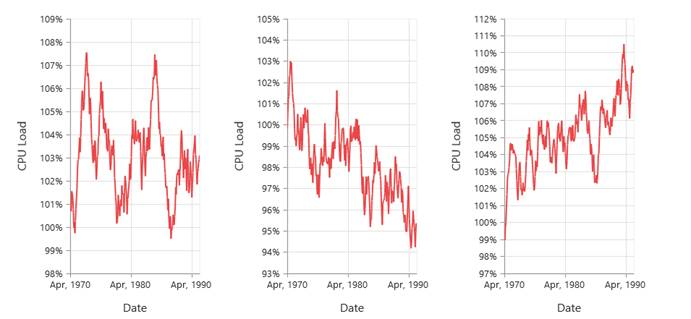
We have rendered chart in canvas and after resizing also it works fine. We have also attached the sample in the below location for your reference.
MvcApplication47.zip

If you still face any concern kindly revert back us by modifying the attached sample along with replication procedure.

And also you have set CSS style to display 3 charts in a row. Kindly share those style details also.

This will help us to find and fix the issue sooner.

Please let us know if you have any concern.

Thanks,

Jayavigneshwaran


RO Rob ONeill March 24, 2015 04:15 PM UTC

Hi,
I have tried your sample and it does work. But this is with data just created on the fly in javascript. It does not seem to work when created in the controller and passed through to the Chart as a collection. My charts are also 3 across ( i modified your style <div style="width: 32%;height: 450px;float: left"> so that the charts would take up equal size, as we would want). 

                        @(Html.EJ().Chart(@chartData.ChartName)
                          .Series(sr =>
                          {
                              foreach (var series in @chartData.SeriesCollection)
                              {
                                  sr.Name(series.SeriesName)
                                      .Type(SeriesType.Line)
                                      .DataSource(series.DataPointCollection)
                                      .XName("Date")
                                      .YName("Value")
                                      .Add();
                              }
                          })
                          .PrimaryXAxis(xAxis => xAxis.ValueType(AxisValueType.Datetime)
                              .LabelFormat("HH:mm:ss dd/MM/yyyy")
                              .Font(font => font.Size("8px"))
                              .LabelIntersectAction(LabelIntersectAction.Rotate45)
                              .IntervalType(ChartIntervalType.Minutes))
                          .PrimaryYAxis(yAxis => yAxis.ValueType(AxisValueType.Double))
                          .EnableCanvasRendering(true)
                          .CanResize(true)

                        )

If you try it this way the chart disappears.

Also i am having trouble setting the datasource on the chart load (and it needs to be created in the controller or an api controller). Can you explain how to set the datasource via remote binding with the Json object .... sr.DataSource(ds => ds.Json(????????))
                        @(Html.EJ().Chart(@chartData.ChartName)
                          .Series(sr =>
                          {
                              foreach (var series in @chartData.SeriesCollection)
                              {
                                  sr.Name(series.SeriesName)
                                      .DataSource(ds => ds.Json(????????))
                                      .Type(SeriesType.Line)
                                      .Width(0.5)
                                      .XName("Date")
                                      .YName("Value")
                                      .Add();
                              }
                          })
                          .Load("onchartload")
                          .PrimaryXAxis(xAxis => xAxis.ValueType(AxisValueType.Datetime)
                              .LabelFormat("HH:mm:ss dd/MM/yyyy")
                              .Font(font => font.Size("8px"))
                              .LabelIntersectAction(LabelIntersectAction.Rotate45)
                              .IntervalType(ChartIntervalType.Minutes))
                          .PrimaryYAxis(yAxis => yAxis.ValueType(AxisValueType.Double))
                          .EnableCanvasRendering(true)
                          .CanResize(true)
                        )

Cheers ... Rob.


JA Jayavigneshwaran Syncfusion Team March 25, 2015 12:30 PM UTC

Hi Rob,

We have analyzed your queries.

Query #1: If you try it this way the chart disappears.

Response: We have created a sample as the scenario mentioned, but still we can’t able to reproduce the reported issue.

We passed data to chart from controller and also we specified the width as 32%. It works fine on chart resize too.

So could you please share the below details

· Share your project or sample page to reproduce the issue

· And share the browser details you are using to reproduce this issue.

Or else we would therefore like to set up a web meeting with you to look into it and provide resolution. Would you please let us know of your availability for this ?

Our team will make every effort to have scheduled on a date. This will help us to find and fix the issue sooner.

Query #2: Can you explain how to set the datasource via remote binding with the Json object

Response: Data source can be bind to chart are of two types.

Local binding – bind the json data or data from SQL

Remote binding – bind the data from a remote server / source

Refer the below link for remote binding

Link: https://asp.syncfusion.com/demos/web/chart/remotebinding.aspx

The below shows how to access data from SQL and render chart

In this to render a chart, data is fetched from an SQL data source in controller and it is passed to view page and chart got render with that.

Here I have used already existing SQL data source. You can create new or use existing one.

The below shows the fetching of data in controller

[CS]

public ActionResult ChartFeatures()

{

var DataSource = new NorthwindDataContext().OutLooks.ToList(); // fetching data from data source

ViewBag.datasource = DataSource; // Storing it in viewbag

return View();

}

The below code snippets shows the processing on data in view page and assigning it to chart

[JS]

<script>

var chartData=@Html.Raw(Json.Encode(ViewBag.datasource));

function onchartload(sender) {

chartData.length = 5;

sender.model.series[0].dataSource =chartData;

sender.model.series[0].xName= "Sender";

sender.model.series[0].yName= "OutId";

}

</script>

You can fetch the data from data base tables dynamically , based on the series length. Assign it to viewbag.datasource1 , viewbag.datasource2 and so on.

In view page assign the data source using for loop to each chart series. In the above code data source is assigned to one series in chart.

The below shows the output of the attached sample

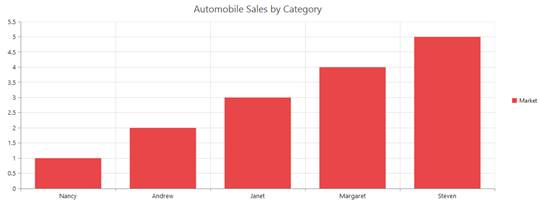
Find the sample from the below location
sql_sever_data_to_chart1.zip

Please let us know if you have any concern.

Thanks,

Jayavigneshwaran


Loader.
Live Chat Icon For mobile
Up arrow icon