- Home
- Forum
- ASP.NET Web Forms
- Marker on Line Chart
Marker on Line Chart
I need to add a vertical line on a line chart to note an important point in the data. Is there an easy way to accomplish this with the ejChart?
Hi Josh,
Thanks for using Syncfusion product.
We have analyzed this. You can use strip line in chart for achieving this. We have made a sample to illustrate this. In this, point (4, 36) is considered as important point and highlighted it with stripline. Find the code snippet to achieve this.
[ASPX]
<PrimaryXAxis Title-Text="Month" MajorGridLines-Visible="false">
<Stripline>
<ejChart:StripLine Start="3.8" End="4.2" Text="High Temperature" TextAlignment="MiddleCenter" Color="#0D97D4" ZIndex="Behind"/>
</Stripline>
</PrimaryXAxis>
In this, start value specified the starting position of
strip line and end values denotes till which value it should render. Find the sample from the below link. We have also included the output screen shot of the sample in the zip below.
Link:
Please let us know if you have any concern.
Thanks,
Jayavigneshwaran
Is it possible to put a strip line on a Date/Time axis? I have followed your example except I used new Date() for the Start and End parameters. It doesn't seem to be appearing.
priamryXAxis: {
stripLine: [
{
borderColor: 'black',
color: 'black',
end: new Date(2015, 01, 06),
font: {
size: '8px', color: 'black', opacity: 0.5
},
start: new Date(2015, 01, 05),
startFromAxis: false,
text: '',
textAlignment: 'middleCenter',
visible: true,
zIndex: 'over',
opacity: 1,
borderWidth: 1,
}
]
}
Thanks for your update.
We have analyzed this. Yes, it is possible to add strip line in date time axis. We have made a sample to render strip line in date time axis chart sample in JS.
The below screen shot shows the output of the attached sample.
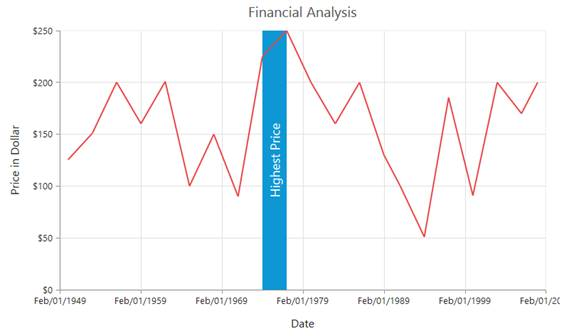
In this the strip line is used to denote the highest price value. Find the sample from the below location.
Attachment.zip
(JS)
Please let us know if you have any concern.
Thanks,
Jayavigneshwaran
- 3 Replies
- 2 Participants
-
JB Josh Bowen
- Dec 22, 2014 08:42 PM UTC
- Jan 6, 2015 05:01 AM UTC
