Overview
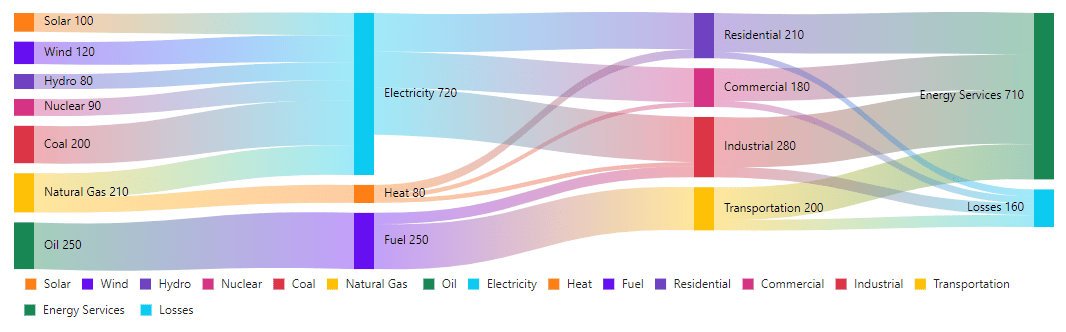
The Blazor Sankey Diagram is a flow visualization component that presents the movement of quantities between stages, with flow widths proportional to the values being transferred. Also known as a Sankey chart, it helps users clearly understand how resources, energy, data, or materials move through complex systems and processes. It is an effective tool for analyzing flow patterns, identifying bottlenecks, and visualizing transfers across multiple process stages.
Why choose Syncfusion Essential Studio® Blazor Sankey?
Get instant detail on hover
Your users see node and link values without a single click—the tooltip cursor surfaces context as they explore the diagram.
Ship without extra configuration
The Blazor Sankey supports legends, orientations, labels, titles, themes, events, printing, and exporting—no third-party add-ons required.
Adapt to any screen size
The layout is fully responsive across desktops, touchscreens, and phones—iOS, Android, and Windows alike.
Six built-in themes ready to match your design system
Material 3, Fluent 2, Tailwind CSS, Bootstrap, Material, and Fabric—switch themes without rebuilding your UI.
Smooth transitions on every data update
No jank, no manual tweaking—the diagram is animated cleanly as your underlying data changes.
Blazor Sankey Diagram Code Example
Easily get started with the Blazor Sankey Diagram using a few simple lines of C# code as demonstrated below. Also, explore our Blazor Sankey Example, which shows you how to render and configure Sankey in Blazor.
@using Syncfusion.Blazor.Sankey

 <SfSankey Nodes=@Nodes Links=@Links Title="Device Usage">
     <SankeyNodeSettings Width="30" Padding="10"></SankeyNodeSettings>
     <SankeyLinkSettings ColorType="SankeyColorType.Source"></SankeyLinkSettings>
     <SankeyLegendSettings Visible="true" Position="SankeyLegendPosition.Bottom">
 </SfSankey>
 @code {

    public List<SankeyDataNode> Nodes = new List<SankeyDataNode>();
    public List<SankeyDataLink> Links = new List<SankeyDataLink>();

     protected override void OnInitialized()
     {
         base.OnInitialized();
         Nodes = new List<SankeyDataNode>()
         {
             new SankeyDataNode() { Id = "Female", Label = new SankeyDataLabel() { Text = "Female (58%)" } },
             new SankeyDataNode() { Id = "Male", Label = new SankeyDataLabel() { Text = "Male (42%)" } },
             new SankeyDataNode() { Id = "Tablet", Label = new SankeyDataLabel() { Text = "Tablet (12%)" } },
             new SankeyDataNode() { Id = "Mobile", Label = new SankeyDataLabel() { Text = "Mobile (40%)" } },
             new SankeyDataNode() { Id = "Desktop", Label = new SankeyDataLabel() { Text = "Desktop (48%)" } },
             new SankeyDataNode() { Id = "< 18", Label = new SankeyDataLabel() { Text = "< 18 years (8%)" } },
             new SankeyDataNode() { Id = "18-26", Label = new SankeyDataLabel() { Text = "18-26 years (35%)" } },
             new SankeyDataNode() { Id = "27-40", Label = new SankeyDataLabel() { Text = "27-40 years (38%)" } },
             new SankeyDataNode() { Id = "> 40", Label = new SankeyDataLabel() { Text = "> 40 years (19%)" } }
         };
         Links = new List<SankeyDataLink>()
         {
             new SankeyDataLink() { SourceId = "Female", TargetId = "Tablet", Value = 12 },
             new SankeyDataLink() { SourceId = "Female", TargetId = "Mobile", Value = 14 },
             new SankeyDataLink() { SourceId = "Female", TargetId = "Desktop", Value = 32 },
             new SankeyDataLink() { SourceId = "Male", TargetId = "Mobile", Value = 26 },
             new SankeyDataLink() { SourceId = "Male", TargetId = "Desktop", Value = 16 },
             new SankeyDataLink() { SourceId = "Tablet", TargetId = "< 18", Value = 4 },
             new SankeyDataLink() { SourceId = "Tablet", TargetId = "> 40", Value = 8 },
             new SankeyDataLink() { SourceId = "Mobile", TargetId = "< 18", Value = 4 },
             new SankeyDataLink() { SourceId = "Mobile", TargetId = "18-26", Value = 24 },
             new SankeyDataLink() { SourceId = "Mobile", TargetId = "27-40", Value = 10 },
             new SankeyDataLink() { SourceId = "Mobile", TargetId = "> 40", Value = 2 },
             new SankeyDataLink() { SourceId = "Desktop", TargetId = "18-26", Value = 11 },
             new SankeyDataLink() { SourceId = "Desktop", TargetId = "27-40", Value = 28 },
             new SankeyDataLink() { SourceId = "Desktop", TargetId = "> 40", Value = 9 }
         };
     }
 }
Legend
Customize the legend to surface exactly what your users need—node details, positioning, and styling are all yours to control. Hover over a legend entry and the related data flow links highlight automatically.
Tooltips
Sankey Diagram offers options to display tooltips that provide details about the values of nodes and links when the mouse hovers over them.


Print and export
Export your Sankey Diagram to PDF, PNG, or JPEG format directly from the client or print it from the browser.
Orientation
Switch between horizontal and vertical orientations to fit your layout and the direction your data naturally flows.


Node labels
Annotate nodes with labels to keep your diagram readable, even as the underlying dataset grows more complex.
Customization
Control node and link colors, label styling, and widths through built-in APIs. Match the diagram to your brand without fighting the default.

Accessibility

Keyboard navigation
Navigate every element, including legend highlights, without touching a mouse.

Screen reader
Screen readers and other assistive technology work out of the box. The component has full WAI-ARIA support and high-contrast visuals.

Right to left (RTL)
Render the text and layout from right to left for RTL-language audiences without extra configuration.
 145+ UI components
1200+ interactive Blazor demos
9.7M+ downloads
145+ UI components
1200+ interactive Blazor demos
9.7M+ downloads

Not sure how to create your first Blazor Sankey Diagram? Our documentation can help.
Read the Getting Started GuideBlazor Components – 145+ UI and DataViz Components
Standalone UI SDKs
Integrate the DataGrid, Chart, Scheduler, Gantt, Rich Text Editor, File Manager, and Diagram UI components into applications to enable rich interaction and visualization, delivering a seamless user experience.
Document Solutions
Integrate the PDF Viewer, DOCX Editor, Spreadsheet Editor, and document-processing libraries into the Blazor applications to enable a smooth user experience.
Frequently Asked Questions
Why should you choose Syncfusion Blazor Sankey?
The Blazor Sankey Diagram with a rich set of features offers the following:
- Visualize and analyze complex flow systems with nodes and links.
- Simple configuration and APIs.
- Supports all modern browsers.
- Mobile-touch friendly and responsive.
Expansive learning resources such as demos and documentation to learn quickly and get started with the Blazor Sankey component.
Where can I find the Syncfusion Blazor Sankey Diagram demo?
You can find our Blazor Sankey demo, which demonstrates how to render and configure Sankey Diagram.
Can I download and utilize Syncfusion Blazor Sankey Diagram for free?
No, this is a commercial product and requires a paid license. However, a free community license is also available for companies and individuals whose organizations have less than $1 million USD in annual gross revenue, 5 or fewer developers, and 10 or fewer total employees.
How do I get started with Syncfusion Blazor Sankey?
A good place to start would be our comprehensive getting started documentation.
Our Customers Love Us





Ready to bring your Blazor Sankey diagram to production?
Join 40K+ enterprises already building with Syncfusion.
See Real Success Stories
Developers around the world trust Syncfusion’s Essential Studio to simplify complex projects and speed up delivery. With a vast library of UI controls, powerful SDKs, and reliable support, Essential Studio helps teams build enterprise-ready applications with confidence.
Read Our Customer StoriesIndustry
Software development
75% Cost reduction
50% Faster development

Industry
Utilities (oil and gas)

450+ hours saved
Streamlined processes and hours of development effort saved.

Advanced, flexible features
Empowered users through robust and versatile functionality.
Industry
Software and technology
1000+ of hours saved
Accelerated development with enterprise-ready UI components.

Efficient file management
Streamlined workflows with document libraries without building them from scratch.
Industry
Software and technology

2 Years of delay avoided
Two years of delays prevented with proactive planning.

On-time delivery
Projects delivered on schedule using trusted controls.
Industry
IT services and IT consulting

Improved performance
Large datasets handled with easy customization and quick debugging.

Highly customizable
Plug-and-play controls with quick template integration.
Industry
Professional services
Instant access
Quick availability of features and resources.
Reduced dependencies
Fewer dependencies for faster development.
Rated by users across the globe



Syncfusion Blazor Sankey Resources


 Figma Download
Awards
Greatness—it’s one thing to say you have it, but it means more when others recognize it. Syncfusion® is proud to hold the following industry awards.