Blazor Chart Wizard - Fast, Guided Chart Configuration
- Quickly build charts with guided steps for selecting series types, binding data, and applying formatting.
- Configure all chart elements including axes, series, legends, tooltips, and export options from a unified and intuitive interface.
- Generate production‑ready chart configurations designed with built‑in accessibility features and responsive behavior.
Trusted by the world’s leading companies

Overview
The Blazor Chart Wizard delivers a streamlined, guiding interface for building charts with ease and precision. It walks users through selecting chart types, mapping data fields to series, applying formatting and styles, and configuring interaction, exporting, and print options. Designed to support both beginners and advanced users, it offers intuitive guidance for fine‑grained control, enabling the creation of fully customized, production‑ready visualizations.
Why choose the Syncfusion Essential Studio® Blazor Chart Wizard?
Guided configuration
The Chart Wizard streamlines chart setup with a clear, step‑by‑step workflow that accelerates creation and helps prevent configuration errors.
Rich formatting
Effortlessly apply themes, color palettes, data labels, markers, and series‑level styling without writing code.
Data binding
Bind charts to in-memory collections, remote data sources, or preprocessed datasets, and quickly map fields to series.
Blazor Chart Wizard code example
The following example demonstrates a typical Chart Wizard workflow: selecting a chart type (e.g., column, line, area, pie), binding the chart to a dataset, mapping x- and y-fields to series. The example also shows how to persist the Chart Wizard configuration and how to programmatically load and apply saved templates.
@using Syncfusion.Blazor.ChartWizard

<SfChartWizard Width="100%">
    <ChartSettings DataSource="@OlympicsDataSource"
                   CategoryFields="@categories"
                   SeriesType="ChartWizardSeriesType.Bar"
                   SeriesFields="@chartSeries">
    </ChartSettings>
</SfChartWizard>

@code {
private readonly List<string> chartSeries = new() { "Gold", "Silver", "Bronze" };
private readonly List<string> categories = new() { "Country", "CountryCode" };

    private readonly List<OlympicsData> OlympicsDataSource = new()
    {
        new OlympicsData { Country = "USA", CountryCode = "USA", Gold = 40, Silver = 44, Bronze = 42 },
        new OlympicsData { Country = "China", CountryCode = "CHN", Gold = 40, Silver = 27, Bronze = 24 },
        new OlympicsData { Country = "Great Britain", CountryCode = "GBR", Gold = 14, Silver = 22, Bronze = 29 },
        new OlympicsData { Country = "France", CountryCode = "FRA", Gold = 16, Silver = 26, Bronze = 22 },
        new OlympicsData { Country = "Australia", CountryCode = "AUS", Gold = 18, Silver = 19, Bronze = 16 }
    };

    public class OlympicsData
    {
        public string? Country { get; set; }
        public string? CountryCode { get; set; }
        public int Gold { get; set; }
        public int Silver { get; set; }
        public int Bronze { get; set; }
    }

}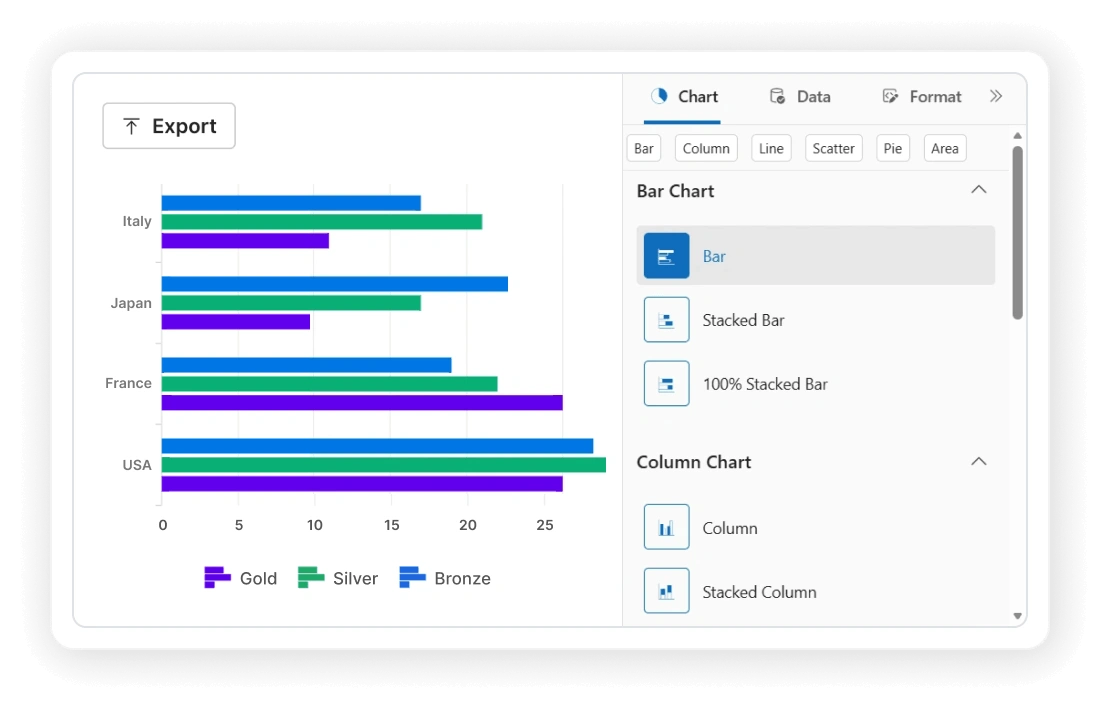
Chart Settings
The ChartSettings component in the Chart Wizard allows you to configure core data and visualization options:
- SeriesType: Specifies the chart type (line, column, bar, area, pie, scatter, etc.).
- DataSource: Sets the chart’s data source.
- CategoryFields: Fields used as categories.
- SeriesFields: Fields plotted as series.
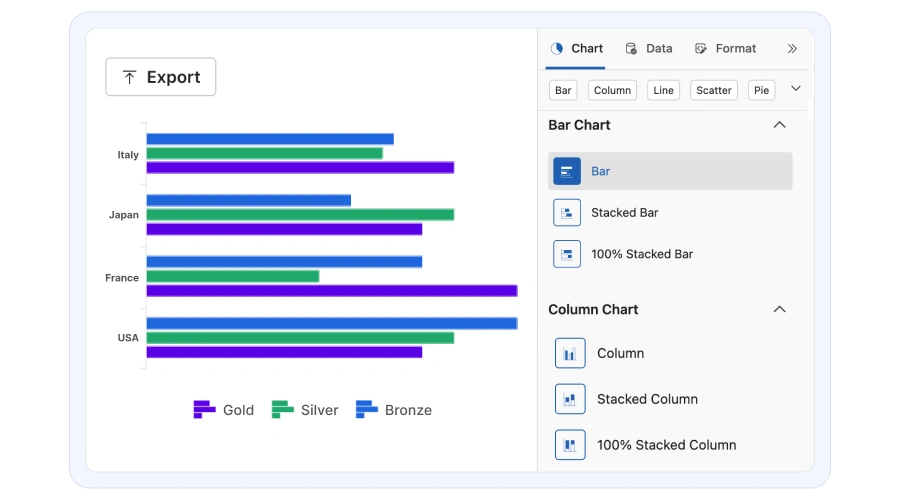
Guided chart configuration
The Chart Wizard guides you through the most important choices — chart type, data binding, and formatting — so you can build a chart that looks right and reads clearly on the first try. You can configure the following options:
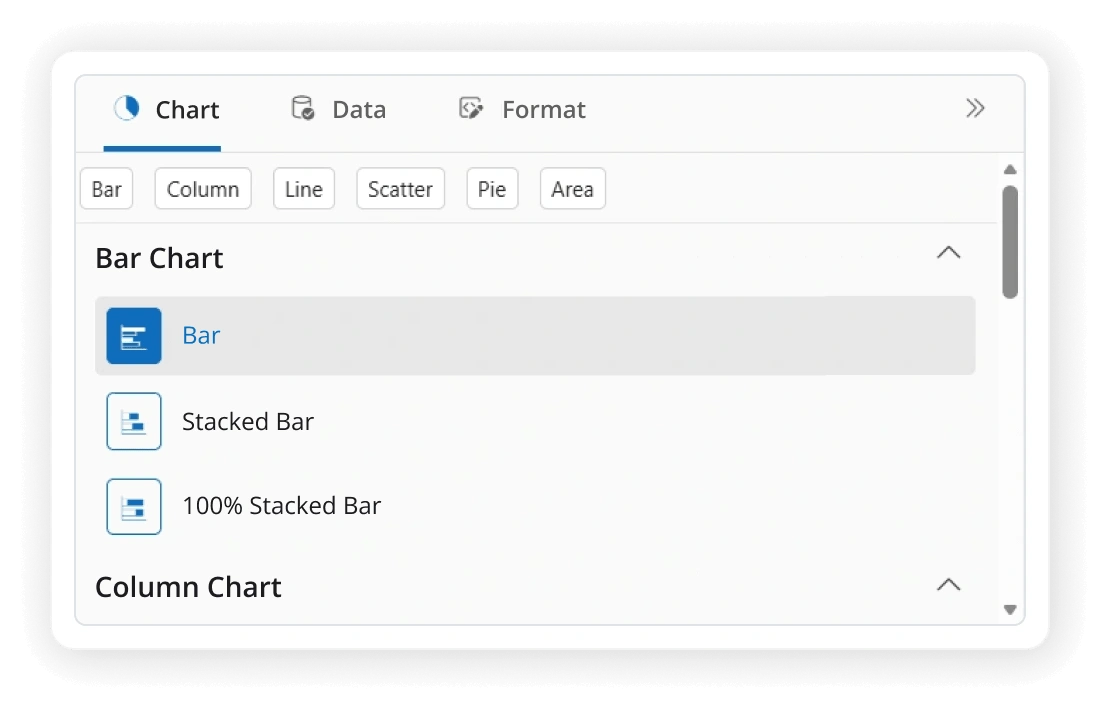
- Chart type
- Data binding
- Series options
- Axes
- Data labels
- Colors
- Tooltips
- Legends
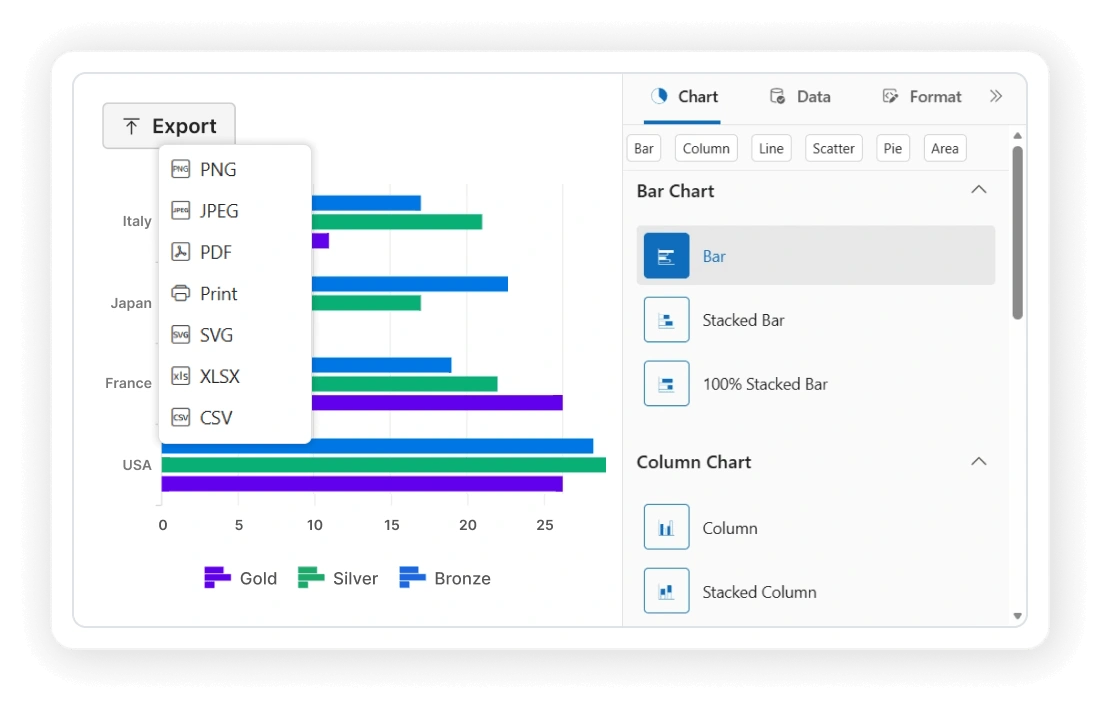
Print and export
Generate printable and downloadable chart outputs with consistent formatting in the Chart Wizard.
- Export as PNG, JPEG, SVG, PDF.
- Print support.
- Batch export.
- Style preservation.
Save and load
Persist and restore chart configurations across different sessions in the Chart Wizard using JSON serialization.
- SaveChart: Serializes chart wizard state.
- LoadChartAsync: Loads saved JSON configuration.
Accessibility
Keyboard navigation
Blazor Chart Wizard ensures that every element is keyboard accessible. Major features like selection, highlight, tooltip, legend collapse and zooming and panning can be performed using keyboard commands alone; no mouse interaction is required. This helps in creating highly accessible applications using this component.
Screen reader
Blazor Chart Wizard views have complete WAI-ARIA accessibility support. This UI includes high-contrast visual elements, helping people with visual impairments have the best viewing experience. Also, valid UI descriptions are easily accessible through assistive technologies such as screen readers.
Right to left (RTL)
Right-to-left rendering allows displaying the text and layout of the Blazor Chart Wizard from right to left. This improves the user experience and accessibility for RTL languages.

Not sure how to create your first Blazor Chart Wizard?
I’d love to read it nowBlazor Components – 145+ UI and DataViz Components
ALL COMPONENTS
SMART COMPONENTS
GRIDS
DATA VISUALIZATION
FILE VIEWERS & EDITORS
DROPDOWNS
NAVIGATION
INPUTS
BUTTONS
INTERACTIVE CHAT
Standalone UI SDKs
Integrate the DataGrid, Chart, Scheduler, Gantt, Rich Text Editor, File Manager, and Diagram UI components into applications to enable rich interaction and visualization, delivering a seamless user experience.
Document Solutions
Integrate the PDF Viewer, DOCX Editor, Spreadsheet Editor, and document-processing libraries into the Blazor applications to enable a smooth user experience.
Our Customers Love Us
Having an excellent set of tools and a great support team, Syncfusion® reduces customers’ development time.Here are some of their experiences.

Blazor components
The speed how they adding new Blazor controls and update theirs functionality.
I am using Blazor components. Searching for Blazor components I found that Syncfusion very fast adopted theirs controls for new development platform. Tech support is fast and excellent. The best of best is that they provide free controls for small business.

Igor L,

CEO, Small-Business
Syncfusion objects with a Blazor
I have used some of the Syncfusion objects with a Blazor application. The support group has always been very helpful.

Kris B,
Software Development Consultant, Small-Business
See Real Success Stories
Developers around the world trust Syncfusion’s Essential Studio to simplify complex projects and speed up delivery. With a vast library of UI controls, powerful SDKs, and reliable support, Essential Studio helps teams build enterprise-ready applications with confidence.
Read Our Customer StoriesIndustry
Software development
75% Cost reduction
50% Faster development
Industry
Utilities (oil and gas)
450+ hours saved
Streamlined processes and hours of development effort saved.
Advanced, flexible features
Empowered users through robust and versatile functionality.
Industry
Software and technology
1000+ of hours saved
Accelerated development with enterprise-ready UI components.
Efficient file management
Streamlined workflows with document libraries without building them from scratch.
Industry
Software and technology
2 Years of delay avoided
Two years of delays prevented with proactive planning.
On-time delivery
Projects delivered on schedule using trusted controls.
Industry
IT services and IT consulting
Improved performance
Large datasets handled with easy customization and quick debugging.
Highly customizable
Plug-and-play controls with quick template integration.
Industry
Professional services
Instant access
Quick availability of features and resources.
Reduced dependencies
Fewer dependencies for faster development.
Rated by users across the globe
Syncfusion Blazor Chart Wizard resources


Awards
Greatness—it’s one thing to say you have it, but it means more when others recognize it. Syncfusion® is proud to hold the following industry awards.

