Overview
The Pivot Chart control organizes and summarizes business data and displays results in a graphic format. It includes major functionalities such as data binding, various chart types, drilling up and down, Excel-like filtering and sorting, PDF exporting, several built-in aggregations, pivot table field list, calculated fields, and common chart UI interactions.
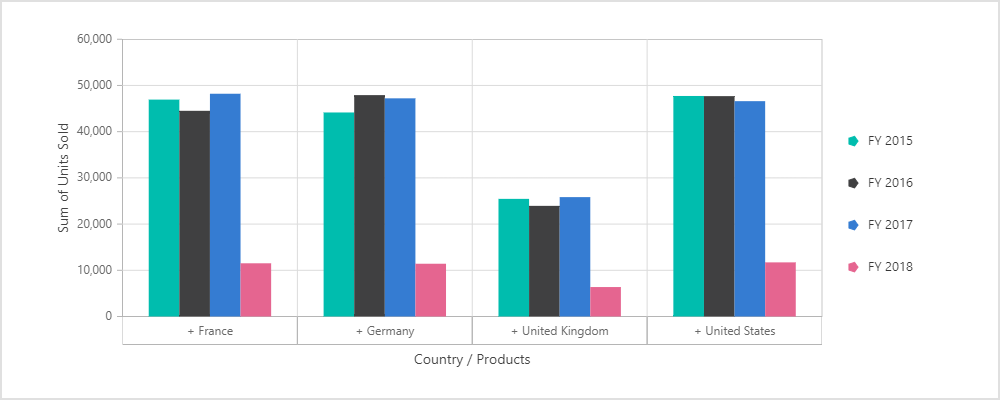
Drill down and drill up
Drill down (expand) and drill up (collapse) actions to visualize pivot information in both abstract and detailed views. By default, data is displayed in a grouped manner.

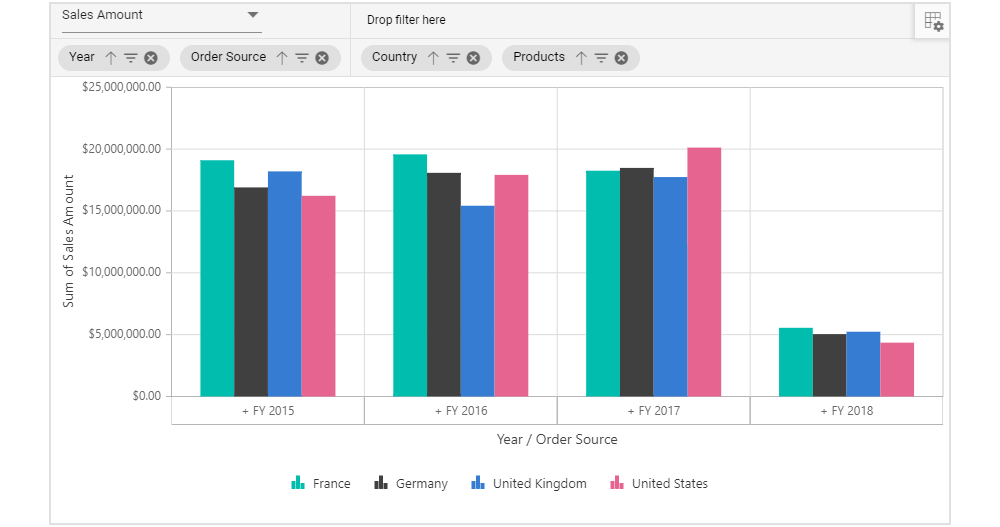
Grouping bar and field list
The field list and grouping bar options allow users to change reports bound with pivot chart dynamically. End users can drag, filter, and sort fields, as well as create pivot report at runtime.
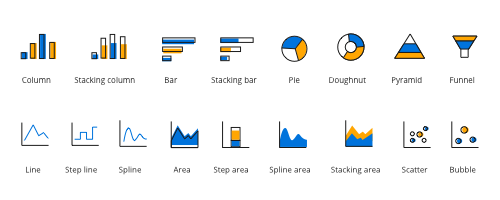
Chart types
The Pivot Chart control includes a functionality for plotting more than 20 chart types. Users can visualize data with different chart types: Line, Column, Area, Bar, StepArea, StackingColumn, StackingArea, StackingBar, StepLine, Pareto, Bubble, Scatter, Spline, SplineArea, StackingColumn100, StackingBar100, StackingArea100, Polar, Radar, Pie, Doughnut, Funnel, and Pyramid. Each one is easily configurable with built-in support for creating stunning visual effects. Users can easily switch between different chart types dynamically.
Series customization
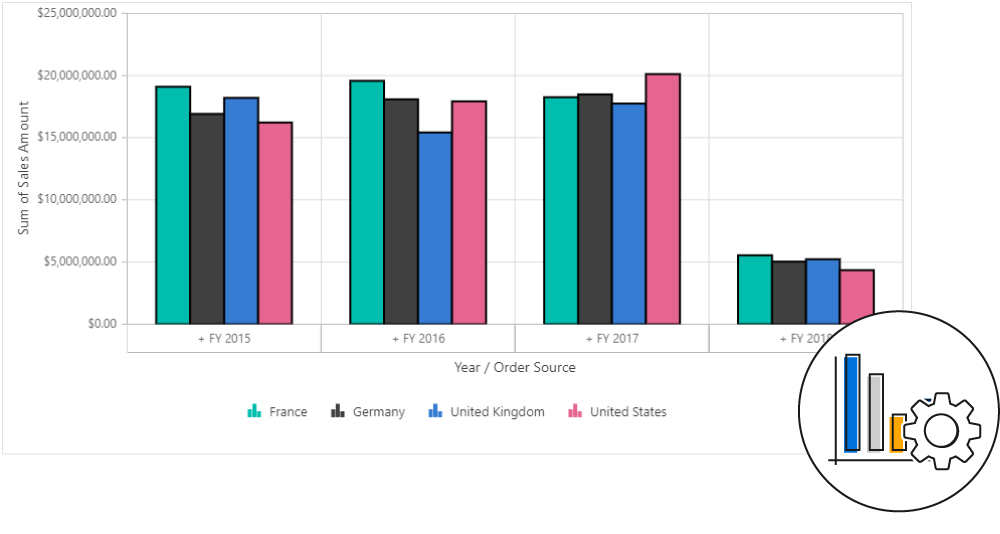
End users can customize the existing series color, border color, and border width of the pivot chart based on their needs, using several built-in options through code behind.
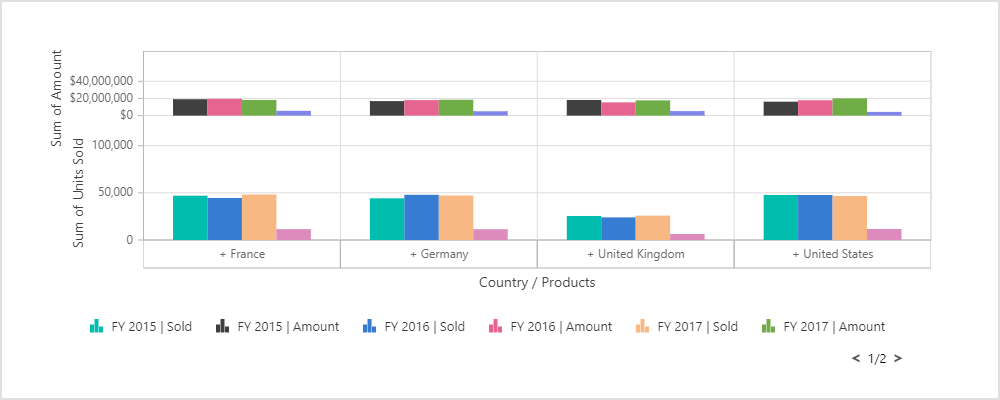
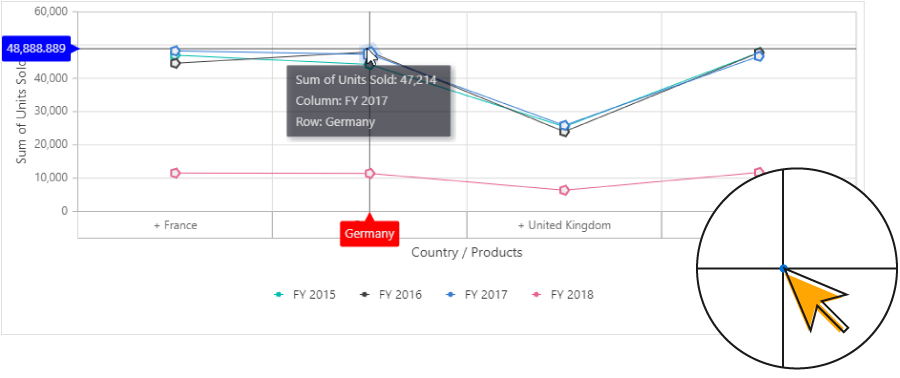
Multiple axes
Allows users to plot multiple series in a single chart with multiple axes as per the value fields bound with the pivot chart. Users can view more information about the individual series with the help of a tooltip.
Legend customization
The legend helps provide information about each series in the pivot chart and users can hide or show any series based on the legend UI at runtime by clicking it. Users can also customize the appearance of legend items in the pivot chart with the help of built-in options like position and shape based on their need.
UI interaction
Marker and cross hair
Markers are symbolic representations of points in a pivot chart. Users can customize the marker with built-in shapes such as circles, rectangles, ellipses, vertical lines, horizontal lines, diamonds, triangles, and pentagons. In addition, images can be used to make the point more attractive. Crosshairs will return the exact data for the X and Y coordinates under the pointer.
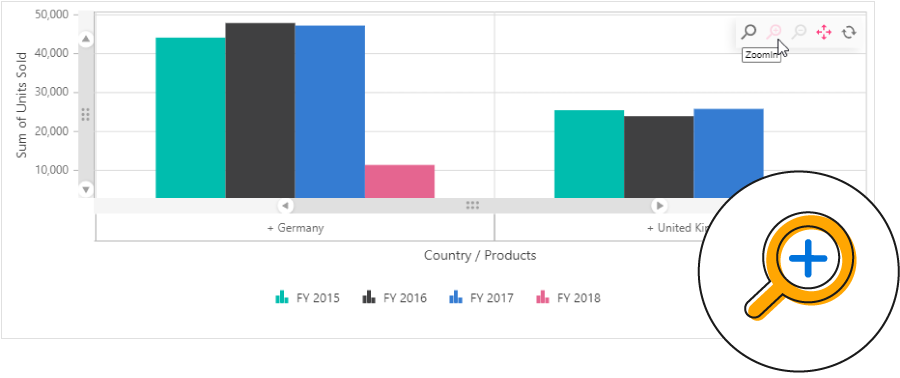
Zooming and scrolling
Users can take a close-up look at a data point plotted in a series at runtime with the zooming feature. When any part of the chart area is zoomed in, scroll bars will automatically appear to let the user view areas beyond the currently displayed chart area.
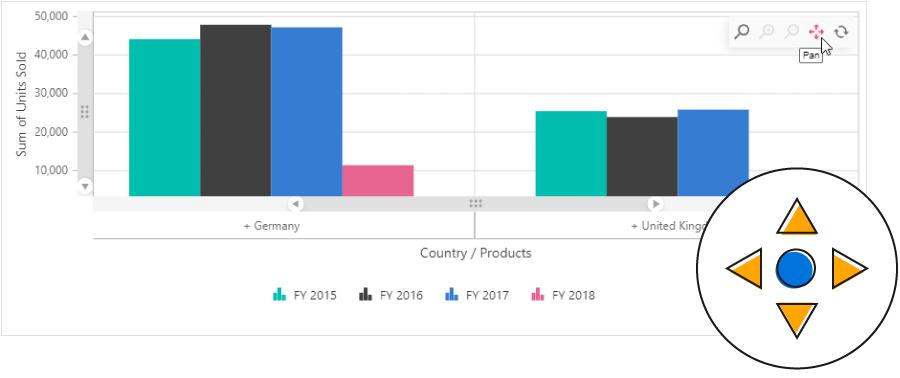
Panning
Users can click and drag the pointer across a zoomed-in chart to navigate to data points for better viewing.
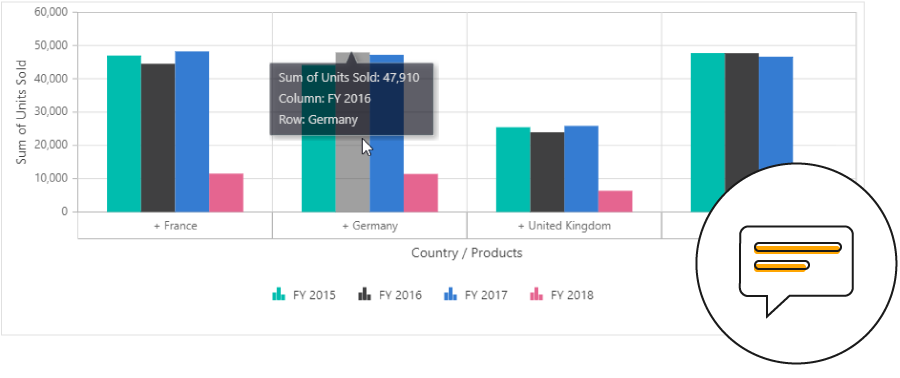
Tooltip
A tooltip provides basic information about a cell while hovering over it with the pointer.
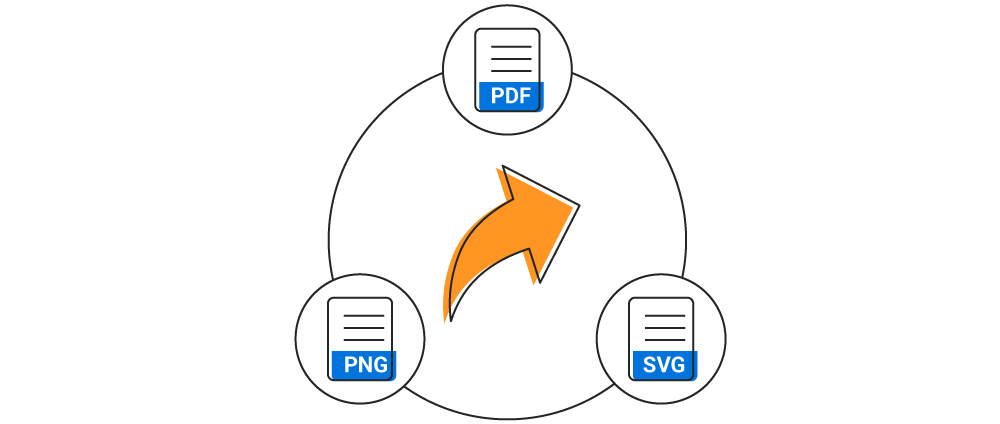
Exporting
The pivot chart can be exported as PDF documents or as image formats such as SVG, PNG, and JPEG.

Globalization and localization
Enables users from different locales to use them by formatting dates, currency, and numbering to suit their preferences.
Discover Syncfusion’s Complete React Component Ecosystem
Explore over 140+ React UI components featuring established, production-ready controls and the latest pure React components built natively for modern web app development.
-
React Components
-
Pure React Components
-
SMART COMPONENTSGRIDSDATA VISUALIZATIONDROPDOWNSFILE VIEWERS & EDITORSBUTTONSINTERACTIVE CHATINPUTSNAVIGATIONFORMSNOTIFICATIONS
-
GRIDSDATA VISUALIZATIONNAVIGATION