Trusted by the world’s leading companies

Overview
The Xamarin.Android Maps control is a powerful data visualization component that displays statistical information for a geographical area. It has highly interactive and customizable features such as zooming, panning, selecting, legends, markers, bubbles, and color mapping. Using the Maps control, you can render various maps, such as for sales, political boundaries, weather, elections, and route maps.

Shape layers
Shape layers provide options to render geographical shapes or custom shapes on maps.

Data
Shapefiles (.shp) and GeoJSON (.json) data can be bound to maps to render any geometric shape.
Customization
The default style of a shape can be customized using the color, stroke, and thickness properties.
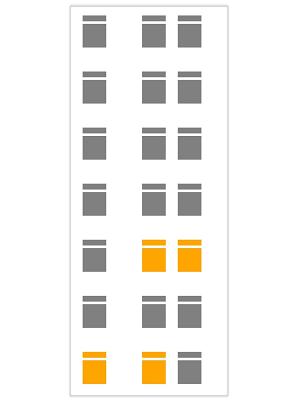
Custom shapes
The Xamarin.Android Maps control allows you to render any custom shape to make a map look like building infrastructure, a sports stadium, plane or bus seat arrangements, and more.

Sublayers
Load multiple shape files in a single map view. For example, add a sublayer over a main shape layer to view geographic features of a country such as rivers, valleys, and cities.
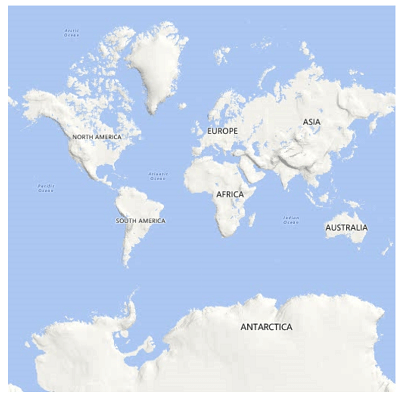
Imagery layers
Imagery layers provide options to visualize satellite, aerial, and street maps, or other imagery tiles without using shapefiles.
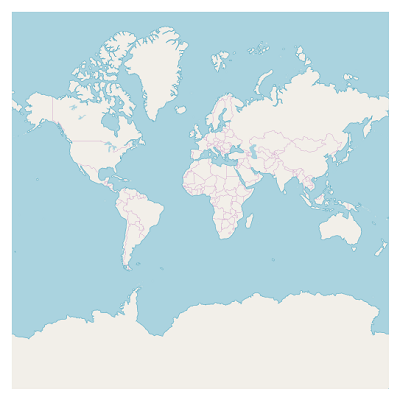
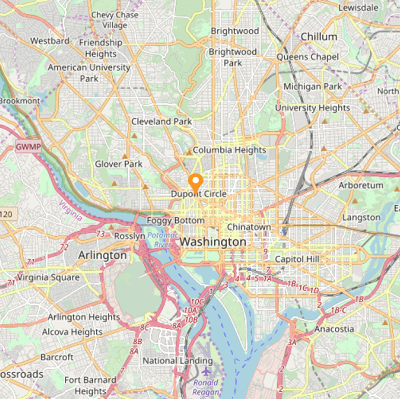
OSM
Xamarin.Android OpenStreetMap (OSM) is a map of the world built by a community of mappers that is free to use under an open license. It allows users to view geographical data in a collaborative way from anywhere on Earth.
Bing Maps
Xamarin.Android Bing Maps is a map of the entire world owned by Microsoft. It supports three types of map views: aerial, aerial with label, and road.
Auto zoom
Set the initial zoom level automatically based on map Geo-bounds or distance (KM/miles) from the geo-point center value.
Data labels
Map shapes can be easily annotated with labels to improve the readability of particular shapes’ names.

Label customization
The look and feel of the default labels can be customized using the font style, size, and color properties.
Smart label alignments
Labels can be aligned smartly within shape boundaries and can be trimmed or hidden to avoid labels overlapping.
Heat map
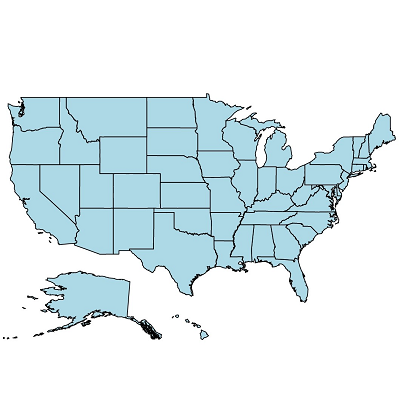
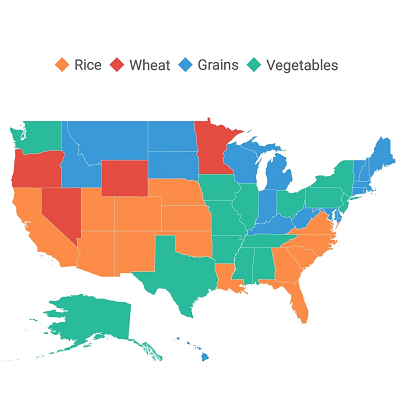
Produce a heat map by customizing the shape colors based on the underlying shape values.
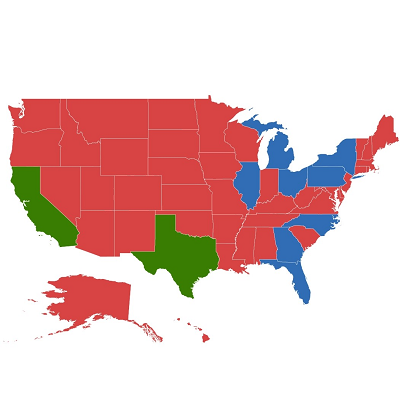
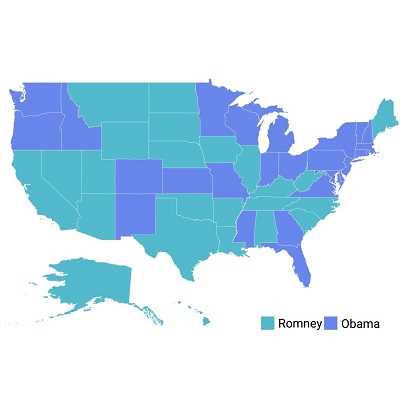
Equal color mapping
Equal color mapping differentiates a shape’s fill color based on its underlying value and color. For example, colors can be applied to states based on their winning political candidates.

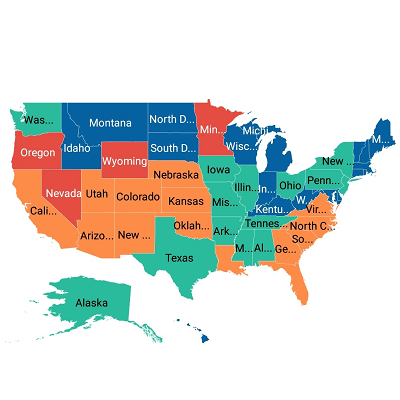
Range color mapping
Colors can be applied to shapes by comparing their values with desired numeric ranges. For example, colors can be applied to states based on their population density.
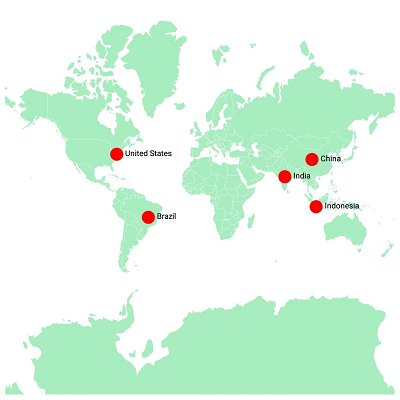
Maps markers
Markers allow you to denote a place with symbols or display some message at a specific latitude and longitude on a map.
Marker types
The marker type can be changed to built-in shapes such as circles, diamonds, rectangles, or squares to highlight a place.
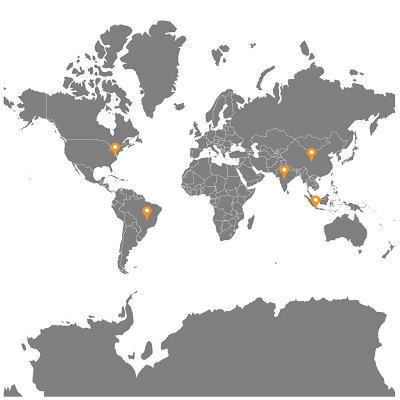
Custom markers
Markers can be customized by adding images or any custom shape to highlight a location.
Map bubbles
Bubbles are used to add additional information to shapes such as population density or land area. They are rendered with various magnitudes and colors based on the underlying data values of the shapes.
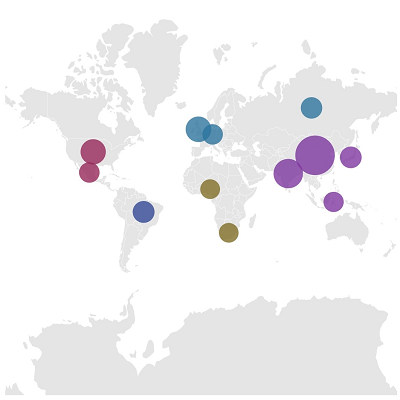
Color customization
The default color of a bubble and its transparency can be customized using the fill and opacity properties.
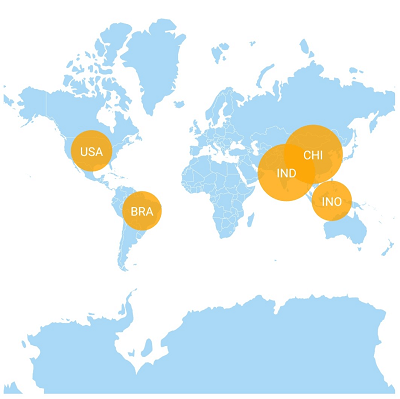
Size customization
The minimum and maximum sizes of a bubble can be customized.
Map legend
A legend is used to provide valuable information for interpreting maps with various colors, shapes, or other identifiers based on the data and application requirements.
Legend position
The position of a legend can be changed or moved to any place inside a map.
Icon customization
The default size of a legend icon can be customized.
User interactions
The end user experience is greatly enhanced by a set of user interaction features such as selection, zooming, and panning.
Selection
A particular area or shape can be selected or highlighted on user interaction to bring the center of the view over other shapes in a map.
Zooming
Zooming allows end users to get a closer look at a particular area of interest on a map by stretching and pinching it.
Panning
Panning allows end users to move a map around to focus on a specific area and navigate across its regions.
150+ XAMARIN CONTROLS
ALL CONTROLS
-
Xamarin.Forms
-
Xamarin.Android
-
Xamarin.iOS
-
GRIDSDATA VISUALIZATIONNAVIGATIONEDITORSPROJECT MANAGEMENTNOTIFICATIONDOCUMENT PROCESSING LIBRARIESVIEWER/EDITORMISCELLANEOUS
-
GRIDSDATA VISUALIZATIONNAVIGATIONEDITORSLAYOUTPROJECT MANAGEMENTNOTIFICATIONVIEWER/EDITORDOCUMENT PROCESSING LIBRARIESMISCELLANEOUS
-
GRIDSDATA VISUALIZATIONNAVIGATIONEDITORSLAYOUTPROJECT MANAGEMENTNOTIFICATIONVIEWER/EDITORDOCUMENT PROCESSING LIBRARIESMISCELLANEOUS
The most downloaded control (based on the nuget.org download count).
Our Customers Love Us
Having an excellent set of tools and a great support team, Syncfusion® reduces customers’ development time.Here are some of their experiences.

A creator of online tutorials for Microsoft technologies, your controls helped to provide a rich user experience. I wanted a look and feel like a Windows Store app and the Tiles are useful for that.
We're using the file formats and Windows/JavaScript list controls a lot. They're fast, easy to use, and the documentation is good and contains examples. Tickets with questions or suggestions were answered within a day, so we're happy to use the Syncfusion libraries.
Rated by users across the globe
Syncfusion Xamarin.Android Resources
Learning
 Documentation
 Documentation


Awards
Greatness—it’s one thing to say you have it, but it means more when others recognize it. Syncfusion® is proud to hold the following industry awards.

