
Xamarin.Forms Diagram - A Powerful and Feature-rich Control
- Automatic layout algorithm for organizational chart, hierarchical tree, and mind map.
- A great flowchart maker and floor planner app.
- Experience seamless interaction and editing capabilities.
Trusted by the world’s leading companies

Overview
The Xamarin Diagram is a feature-rich library for visualizing, creating, and editing interactive diagrams. It helps create flowchart, organizational charts, mind maps, use case diagrams, and more using code or a visual interface.
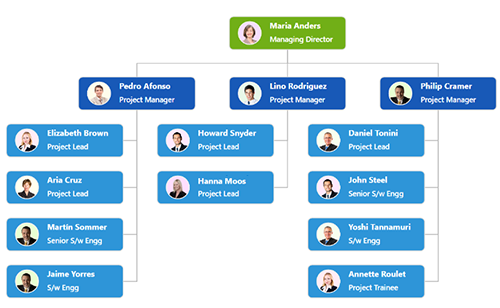
Organizational chart
The organizational chart helps visualize the structure of an organization. Syncfusion Xamarin.Forms Diagram control provides built-in automatic layout algorithm specifically made for organizational charts to arrange parent and child nodes’ positions automatically.
Mind map
Like the organizational chart, Xamarin.Forms Diagram control provides built-in automatic layout algorithm for the mind map diagram, which links the central topic to the sub-topics placed around the central topic in the diagram surface.

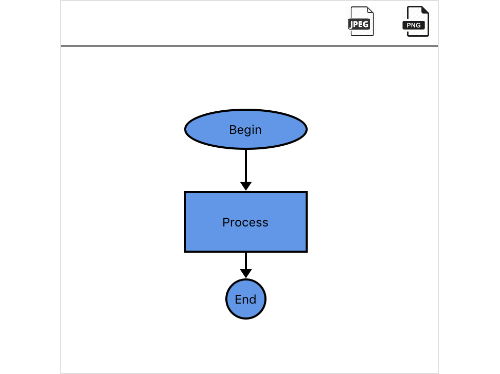
Flowchart
A flowchart is a visual representation of a process in which each step is represented by a different shape, which contains a short description. The Xamarin.Forms Diagram control offers various feature sets to build flowcharts easily.

Nodes
Visualize any graphical object using nodes, which can be arranged and manipulated at the same time on a diagram page.
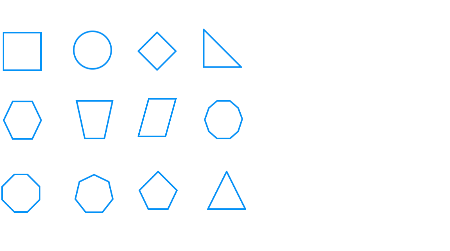
Built-in nodes
Use the predefined objects that are built in the diagram control.
Custom nodes
Create and add custom nodes easily.
Templates
In addition to the above, design a node UI template and reuse it across multiple nodes.
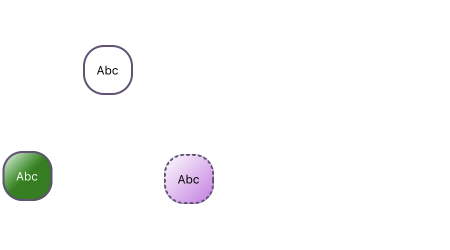
Appearance
Fully customize the appearance of a node.
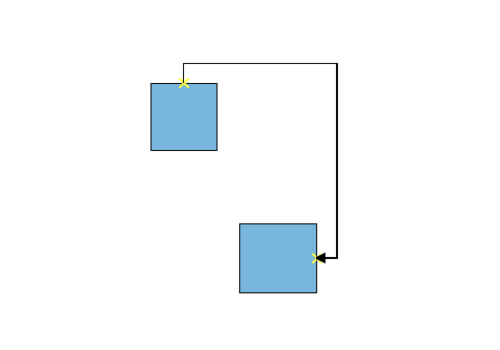
Connectors
Connectors represent the relationship between two nodes. Some of the key features are as follows.
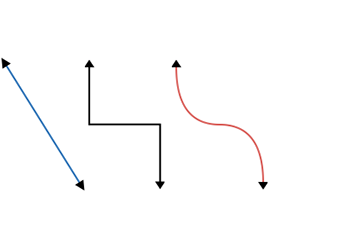
Types
Connectors are straight, orthogonal, and curved . Choose any of these based on the type of diagram or relationship between the connected notes.
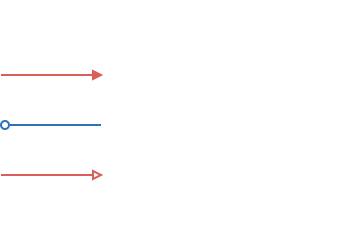
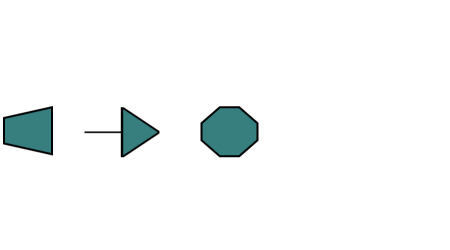
Arrowheads
Use different types of predefined arrowheads to illustrate flow direction in a flowchart diagram. Also, build custom arrowheads based on the requirement.
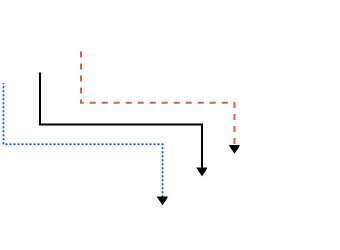
Appearance
Like nodes, connectors' look and feel can also be customized as required. The Xamarin.Forms Diagram control provides a rich set of properties to customize connector color, thickness, dash and dot appearance, rounded corners, as well as decorators.
Data binding
Populate the organizational chart or mind map diagrams based on data from data sources. In addition, data in any format can easily be converted, mapped, and consumed in the diagram by setting a few properties, without having to write any code. Diagram also supports loading data from a List or IEnumerable collection.

Ports (connection points)
Connect to specific places on a node using different types of ports or connecting points.
Labels (annotations)
More information can be shown by adding text or labels on nodes and connectors.
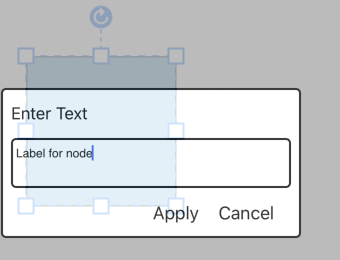
Edit
Add and edit text at runtime and mark it read-only if it should not be edited.
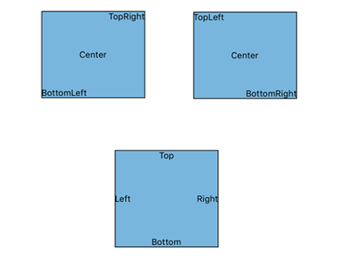
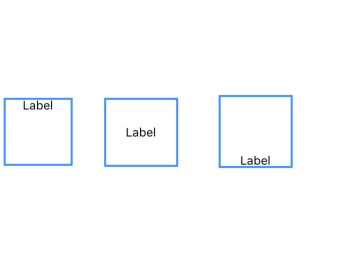
Multiple labels
Add any number of labels and further align them individually.
Alignment
Labels include sophisticated alignment options. Automatically align when a node or connector moves.
Interactive features
Use interactive features to improve the editing experience of a diagram at run time. Edit a diagram easily on touchscreens.
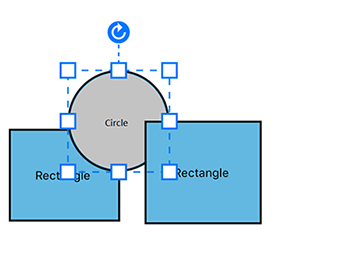
Resize and rotate
Resize a node in eight different directions and lock the node’s aspect ratios to keep its shape. Rotate selected nodes 360 degrees.
Undo, redo, and clipboard
For editing mistakes, undo and redo commands reverse recent changes. The selected object in the diagram can also be cut, copied, and pasted.
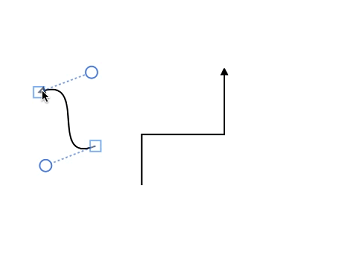
Connector editing
Edit the connectors' route easily by dragging thumbs that are visible after selection.
Z-order
When multiple objects overlap, the z-order controls which object needs to be at the top and which at the bottom.
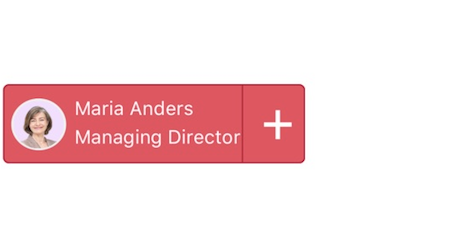
Quick commands
Frequently used commands like delete, connect, and duplicate can be shown as buttons near a selector. This makes it easy to perform those operations quickly instead of searching for the correct buttons in a toolbox.
Drawing tools
Draw connectors and connect it with nodes interactively by just touch and move on the drawing area.

Zoom and pan tools
View a large diagram closer or wider by zooming in and out. Also, navigate from one region to another by panning through the diagram.
Stencil
Includes a gallery of stencils in addition to reusable symbols and nodes that can be dragged onto the surface of a diagram.

Overview panel
Improve the navigation experience when exploring large diagrams. The panel displays a small preview of the full diagram page that further allows zooming and panning within it.

Serialization
Save the diagram state in JSON format and load it back later for further editing using the serializer.

Exporting
Export the diagram in PNG and JPEG image file formats.
Miscellaneous
In addition to the above, there are several other features that enhance the diagramming experience.
Gridlines
Gridlines help in the alignment of objects. Precisely align nodes, connectors, and annotations when dragging by snapping them to the nearest gridlines.

Stencil objects with annotation
Stencils are able to load symbols like connectors and nodes (all shapes), and custom shapes with annotations into the Diagram component.

Xamarin.Forms Diagram code example
Easily get started with the Xamarin.Forms Diagram using a few simple lines of C# code example as demonstrated below. Also explore our Xamarin Diagram Example that shows you how to render and configure a diagram in Xamarin.Forms.
<?xml version="1.0" encoding="utf-8" ?>
    <ContentPage xmlns="http://xamarin.com/schemas/2014/forms"
                xmlns:x="http://schemas.microsoft.com/winfx/2009/xaml"
                xmlns:local="clr-namespace:GettingStarted;assembly=GettingStarted"
                xmlns:syncfusion="clr-namespace:Syncfusion.SfDiagram.XForms;assembly=Syncfusion.SfDiagram.XForms"
                x:Class="GettingStarted.Sample">
    <ContentPage.Content>
    <!--Initializes the SfDiagram-->
        <syncfusion:SfDiagram x:Name="diagram" />
    </ContentPage.Content>
    </ContentPage>
using Syncfusion.SfDiagram.XForms;
using Xamarin.Forms;
namespace GettingStarted
{
public class App : Application
{
SfDiagram diagram;
public App()
{
//Initializes the SfDiagram
diagram= new SfDiagram();
MainPage = new ContentPage { Content = diagram};
}
}
}150+ XAMARIN UI CONTROLS
ALL CONTROLS
-
Xamarin.Forms
-
Xamarin.Android
-
Xamarin.iOS
-
GRIDSDATA VISUALIZATIONNAVIGATIONEDITORSLAYOUTPROJECT MANAGEMENTNOTIFICATIONDOCUMENT PROCESSING LIBRARIESVIEWER/EDITORMISCELLANEOUSCHAT
-
GRIDSDATA VISUALIZATIONNAVIGATIONEDITORSLAYOUTPROJECT MANAGEMENTNOTIFICATIONVIEWER/EDITORDOCUMENT PROCESSING LIBRARIESMISCELLANEOUS
-
GRIDSDATA VISUALIZATIONNAVIGATIONEDITORSLAYOUTPROJECT MANAGEMENTNOTIFICATIONVIEWER/EDITORDOCUMENT PROCESSING LIBRARIESMISCELLANEOUS
The most downloaded control (based on the nuget.org download count).
Frequently Asked Questions
Why should you choose Syncfusion Xamarin Diagram?
Automatic layout algorithm for organization charts, hierarchical trees, and mind maps.
Flow chart maker, floor planner app, and visualizing the diagram with a data source can be made easy.
Seamless interaction and editing capabilities.
- One of the best Xamarin Diagram in the market that offers feature-rich UI to interact with the software.
- Simple configuration and API.
- Use a lightweight and truly native.
Expansive learning resources such as demos and documentation to learn quickly and get started with Xamarin Diagram.
Where can I find the Syncfusion Xamarin Diagram demo?
You can find our Xamarin Diagram demo here.
Can I download and utilize the Syncfusion Xamarin Diagram for free?
No, this is a commercial product and requires a paid license. However, a free community license is also available for companies and individuals whose organizations have less than $1 million USD in annual gross revenue, 5 or fewer developers, and 10 or fewer total employees.
How do I get started with Syncfusion Xamarin Diagram?
A good place to start would be our comprehensive getting started documentation.
Our Customers Love Us
Having an excellent set of tools and a great support team, Syncfusion® reduces customers’ development time.Here are some of their experiences.

It has more tools and support than its competitors
Syncfusion essential studio samples are really helpfull. Docking Manager, Diagram, Undo-Redo, Mapping, Themes

HALİT A,

Software Developer
Nice suite of components
A very complete set of components, that has an edge on other major vendors which offer components. A lot less code required to use and code samples for more complete components. Integrates well with other 3rd party components.

John A.
C# Developer (Contract)
Rated by users across the globe
Syncfusion Xamarin.Forms Resources
Learning
 Documentation
 Documentation


Awards
Greatness—it’s one thing to say you have it, but it means more when others recognize it. Syncfusion® is proud to hold the following industry awards.

