
Xamarin.Forms Sunburst Chart Control
- Visualize hierarchical structured data in a concentric circle layout.
- Expand the children of a selected item using drill-down support.
- Enhance with an interactive legend, tooltips, and selection support.
Trusted by the world’s leading companies

Overview
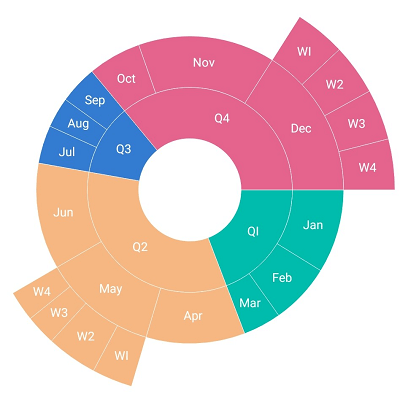
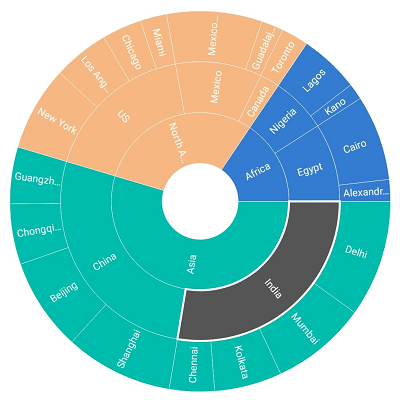
The Xamarin Sunburst Chart, also known as radial treemap is a data visualization component that visualizes hierarchical data using a concentric circle layout. The innermost circle represents the root level of the hierarchy. Its rich feature set includes functionalities like data binding, legends, animations, data labels, selection, tooltips, and drill-down.
Sunburst levels
The Xamarin.Forms Sunburst Chart allows you to add more than one hierarchical data level in the levels collection.
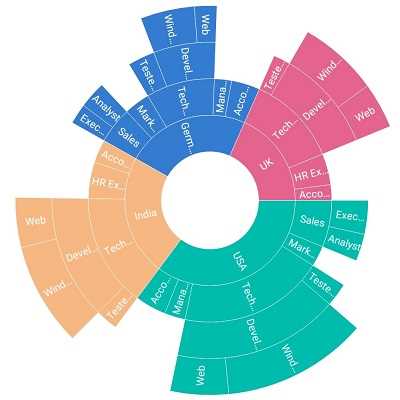
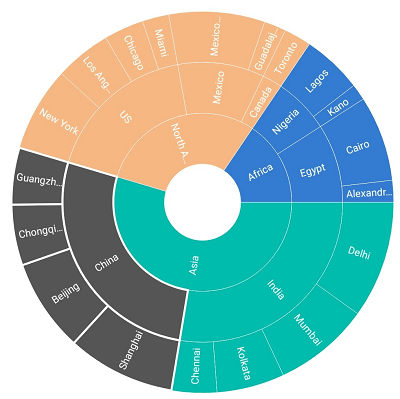
Hierarchical levels
The Xamarin.Forms Sunburst Chart visualize the levels for a hierarchical data collection that contain tree-structured data.
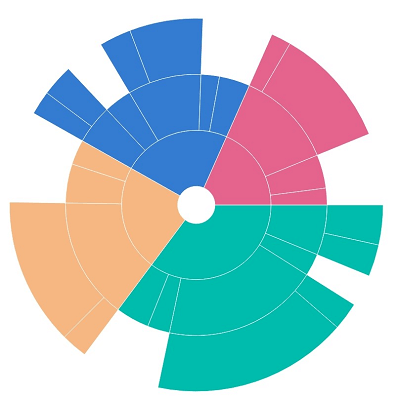
Radius
Customize the inner and outer radii of a sunburst chart.
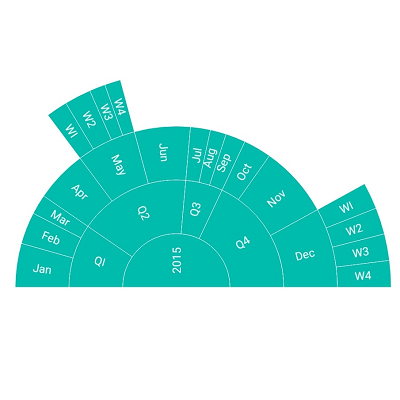
Angle customization
Customize the start and end angles of a sunburst chart to any direction to improve readability.
Data labels
Easily annotate the Xamarin.Forms Sunburst Chart segments with labels to help improve readability of data.
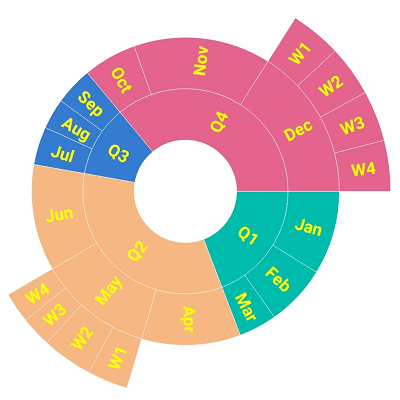
Label customization
Customize the look and feel of the default labels using the font style, size, and color properties.
Label overflow
Handle data overlapping or overflowing out of segments using label trimming or hiding functionalities.
Display mode
Display the data labels in either a normal or rotation direction to enhance readability.
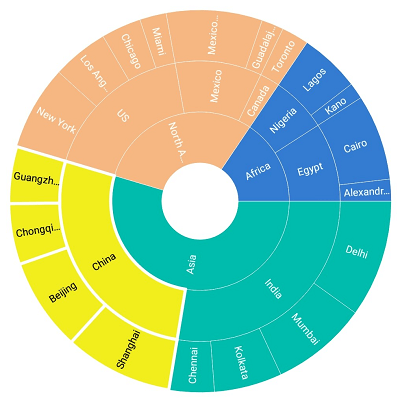
Selection
Interactively select and highlight a segment. This is widely used to navigate to another page with the information of a selected segment or to update the information about a selected segment in the same page.
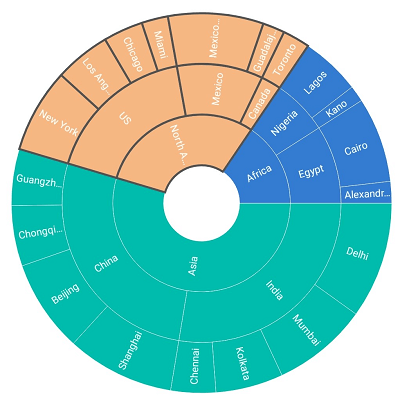
Highlight by color
Select or highlight the segments with color to bring them to the center of attention over the other segments.
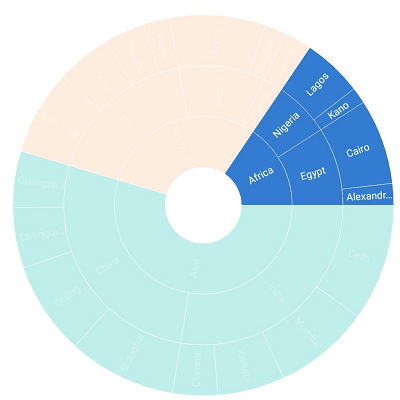
Highlight by opacity
Select or highlight the segments by reducing the transparency (opacity) of other segments to bring the selection to the center of attention.
Highlight by stroke
Select or highlight the segments by strokes to bring them to the center of attention over the other segments.
Selection type
Select or highlight the segments by color to bring them to the center of attention over the other segments. The Xamarin.Forms Sunburst Chart control provides options to highlight a segment as a group of entire node segments, the parent node of the selected segment, the child node of the selected segment, or the selected segment alone.
Customization
Selected colors and strokes can be customized.
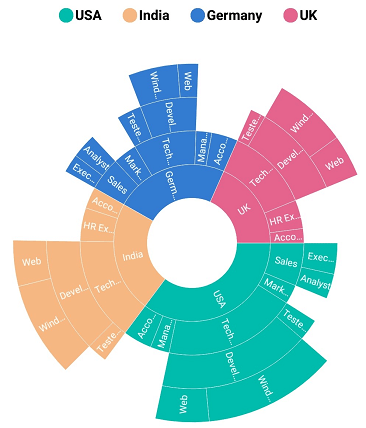
Legend
Legends are used to provide valuable information for sunburst segments with various colors, shapes, or other identifiers.
![]()
Icon types
Change the type of legend icon to built-in shapes such as circles, rectangles, crosses, diamonds, triangles, or pentagons to improve readability of the chart.
Customization
Customize the positioning of the legend to anywhere in the chart area. The default legend label font and icon can also be customized.
Tooltip
The Tooltip control displays a pop-up with additional information when the mouse pointer touches a data point. The tooltip view can be customized with the data template.

Drill-down
The Xamarin.Forms Sunburst Chart control provides a drill-down option with animation for visualizing large sets of data in a minimal data view.
150+ XAMARIN UI CONTROLS
ALL CONTROLS
-
Xamarin.Forms
-
Xamarin.Android
-
Xamarin.iOS
-
GRIDSDATA VISUALIZATIONNAVIGATIONEDITORSLAYOUTPROJECT MANAGEMENTNOTIFICATIONDOCUMENT PROCESSING LIBRARIESVIEWER/EDITORMISCELLANEOUSCHAT
-
GRIDSDATA VISUALIZATIONNAVIGATIONEDITORSLAYOUTPROJECT MANAGEMENTNOTIFICATIONVIEWER/EDITORDOCUMENT PROCESSING LIBRARIESMISCELLANEOUS
-
GRIDSDATA VISUALIZATIONNAVIGATIONEDITORSLAYOUTPROJECT MANAGEMENTNOTIFICATIONVIEWER/EDITORDOCUMENT PROCESSING LIBRARIESMISCELLANEOUS
The most downloaded control (based on the nuget.org download count).
Our Customers Love Us
Having an excellent set of tools and a great support team, Syncfusion® reduces customers’ development time.Here are some of their experiences.

Amazing tool, great designs
Using Xamarin templates from Syncfusion I can focus on the code and do not have to worry about design. Very easy to implement.

Dirk F,

Software Development Engineer, Small-Business
Essential for any Xamarin developer!
A large number of components that complement or improve almost everything that does not yet exist in Xamarin. The support is the best I've ever seen! They fix bugs quickly and are always willing to listen to suggestions.

Cezar W,
Co-Founder, Small-Business
Rated by users across the globe
Syncfusion Xamarin.Forms Resources
Learning
 Documentation
 Documentation


Awards
Greatness—it’s one thing to say you have it, but it means more when others recognize it. Syncfusion® is proud to hold the following industry awards.

