
Overview
The Xamarin.Forms Chart component supports 10 different types of financial technical indicators such as RSI, momentum, Bollinger bands, accumulation distribution, EMA, SMA, stochastic, ATR, MACD, and TMA indicators.
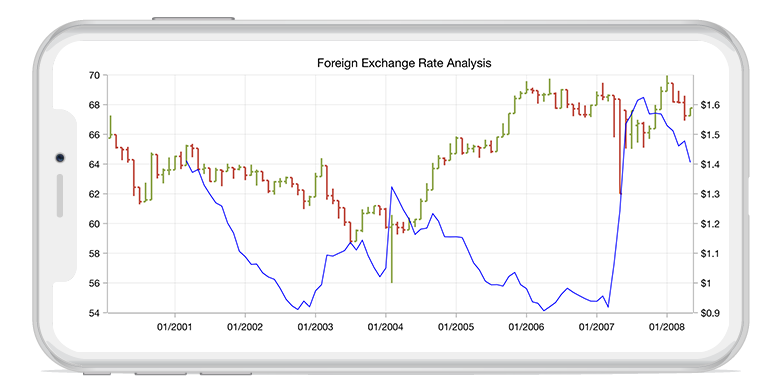
Average true indicator
The average true indicator measures stock volatility by comparing the current value with the previous value.
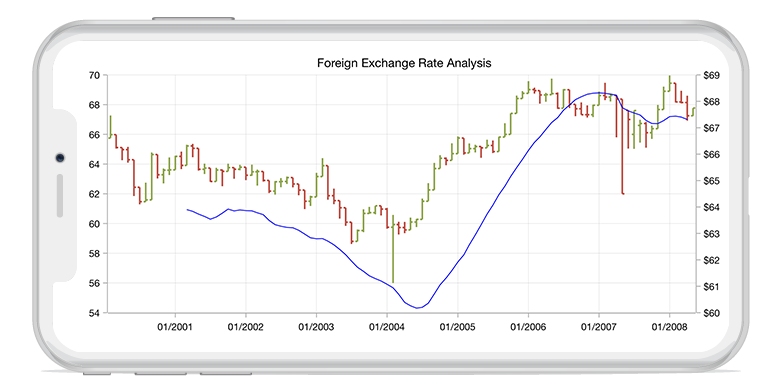
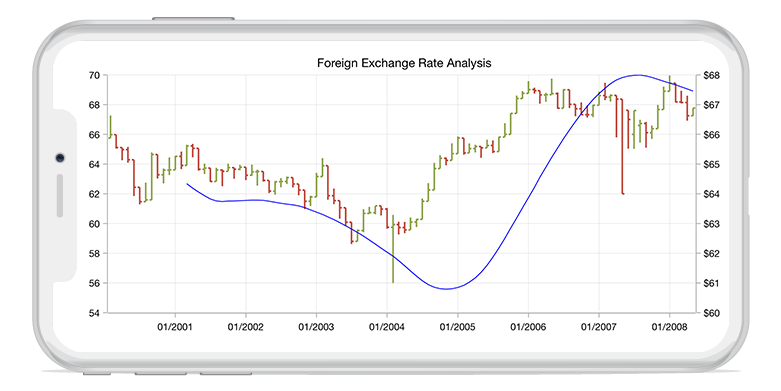
Simple moving average indicator
The simple moving average indicator is a simple, arithmetic moving average that is calculated by adding the closing price for a number of time periods and dividing the total value by the number of time periods.
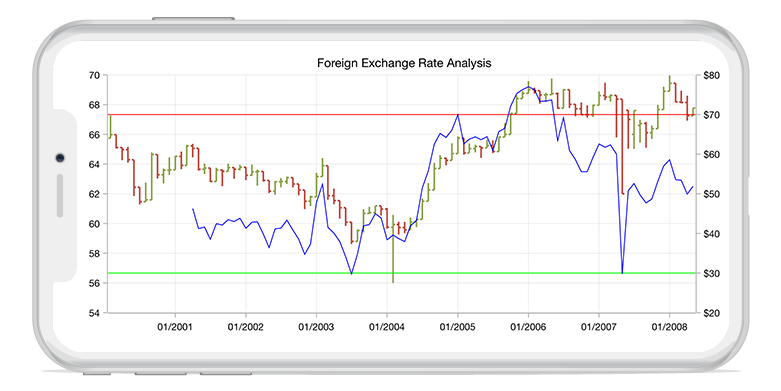
Relative strength index indicator
The relative strength index indicator shows how strongly a stock is moving in its current direction.
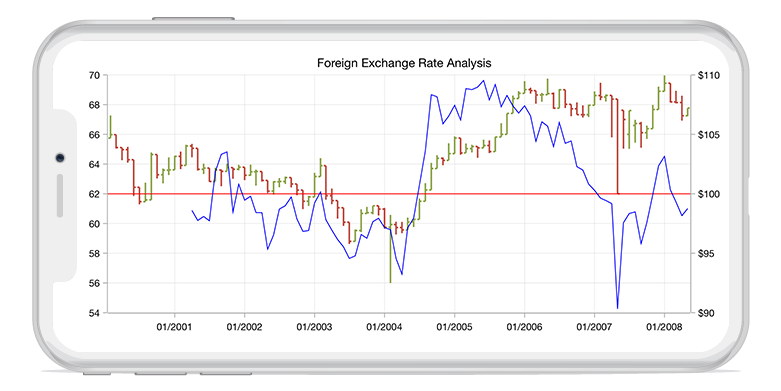
Accumulation distribution indicator
The accumulation distribution indicator combines price and volume to show how money may be flowing into or out of a stock.

Momentum indicator
The momentum indicator shows the speed at which the price of the stock is changing.
Stochastic indicator
The stochastic indicator shows the status of a stock compared to a previous state.
Exponential moving average indicator
The exponential moving average indicator is a type of moving average indicator that emphasizes the most recent data point.
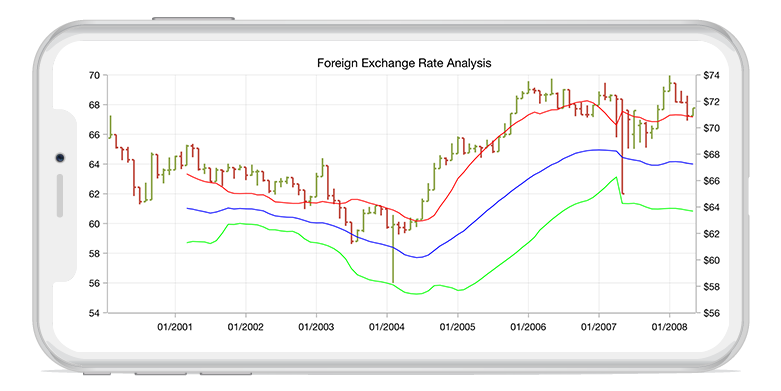
Triangular moving average indicator
The triangular moving average indicator is a type of moving average indicator that shows the mean price over a specified number of data points.
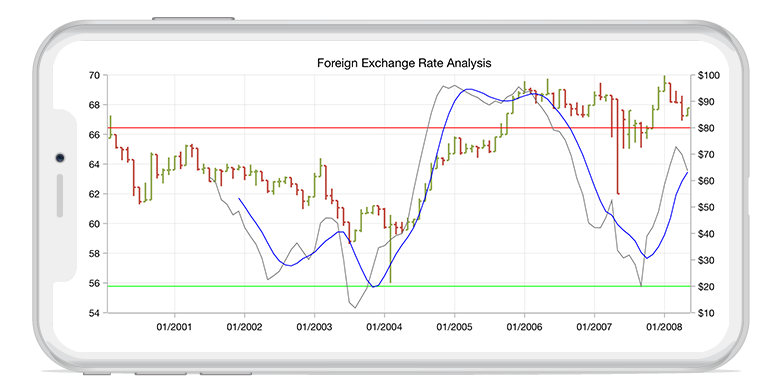
Bollinger band indicator
A chart overlay that shows the upper and lower limits of normal price movements based on the standard deviation of prices.
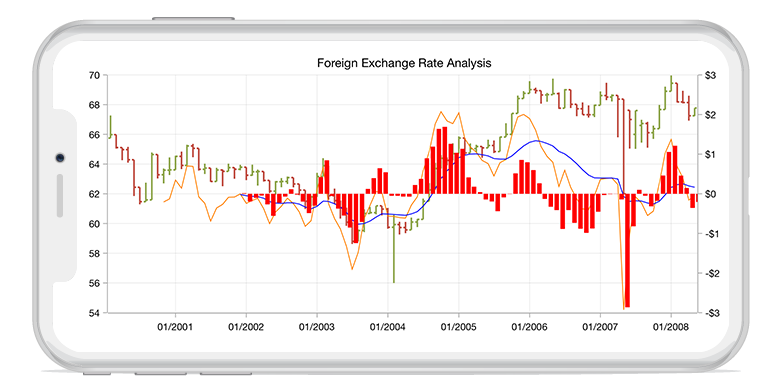
MACD Indicator
The moving average convergence divergence indicator is based on the difference between two exponential moving average indicators.
Our Customers Love Us


150+ XAMARIN UI CONTROLS
-
Xamarin.Forms
-
Xamarin.Android
-
Xamarin.iOS
-
GRIDSDATA VISUALIZATIONNAVIGATIONEDITORSLAYOUTPROJECT MANAGEMENTNOTIFICATIONDOCUMENT PROCESSING LIBRARIESVIEWER/EDITORMISCELLANEOUSCHAT
-
GRIDSDATA VISUALIZATIONNAVIGATIONEDITORSLAYOUTPROJECT MANAGEMENTNOTIFICATIONVIEWER/EDITORDOCUMENT PROCESSING LIBRARIESMISCELLANEOUS
-
GRIDSDATA VISUALIZATIONNAVIGATIONEDITORSLAYOUTPROJECT MANAGEMENTNOTIFICATIONVIEWER/EDITORDOCUMENT PROCESSING LIBRARIESMISCELLANEOUS