Overview
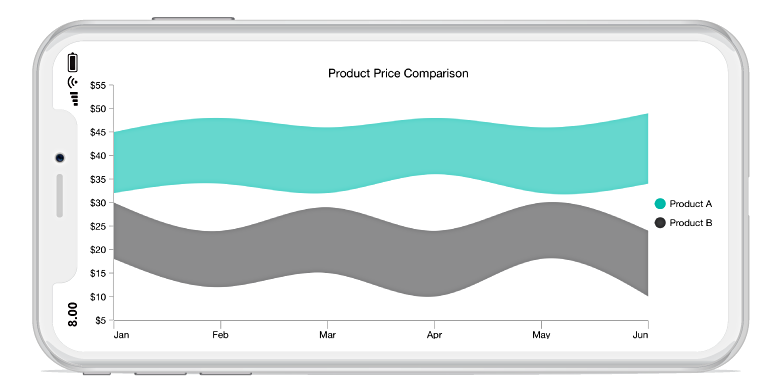
The Xamarin.Forms spline range area chart is used to display continuous data points as a set of splines that vary between high and low values over intervals of time and across different categories.
Key features
Spline type
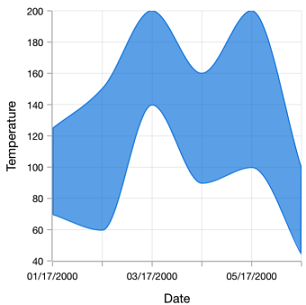
Four different types of rendering such as natural, monotonic, cardinal, and clamped.
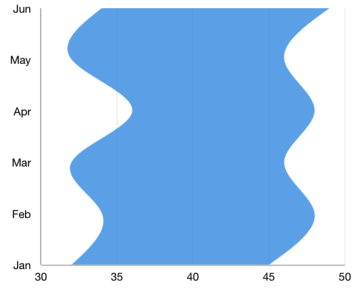
Vertical rendering
Rotate the spline range area chart to plot the data in a vertical direction and view the data from a different perspective.
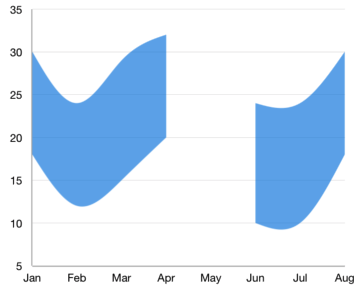
Empty points
Empty or null data points are elegantly handled in spline range area charts.
Code example
Easily get started with Xamarin Spline Range Area Chart using a few simple lines of C# code, as demonstrated below,
<?xml version="1.0" encoding="utf-8" ?>
<ContentPage xmlns="http://xamarin.com/schemas/2014/forms"
             xmlns:x="http://schemas.microsoft.com/winfx/2009/xaml"
             xmlns:local="clr-namespace:ChartExample"
             xmlns:chart="clr-namespace:Syncfusion.SfChart.XForms;assembly=Syncfusion.SfChart.XForms"
             x:Class="ChartExample.MainPage">

    <ContentPage.BindingContext>
        <local:ViewModel/>
    </ContentPage.BindingContext>

    <chart:SfChart>

        <chart:SfChart.PrimaryAxis>
            <chart:CategoryAxis/>
        </chart:SfChart.PrimaryAxis>

        <chart:SfChart.SecondaryAxis>
            <chart:NumericalAxis/>
        </chart:SfChart.SecondaryAxis>

        <chart:SplineRangeAreaSeries ItemsSource="{Binding Data}" XBindingPath="Month" High="High" Low="Low"/>

    </chart:SfChart>

</ContentPage>
public class Model
{
public string Month { get; set; }
public double High { get; set; }
public double Low { get; set; }
public Model(string xValue, double high, double low)
{
Month = xValue;
High = high;
Low = low;
}
}
public class ViewModel
{
public ObservableCollection<Model> Data { get; set; }
public ViewModel()
{
Data = new ObservableCollection<Model>()
{
new Model("Jan", 50, 12),
new Model("Feb", 70, 13),
new Model("Mar", 65, 14),
new Model("Apr", 57, 15),
new Model("May", 48, 10),
};
}
}Learning resources

Explore the Xamarin.Forms Spline Range Area Chart example from GitHub to learn how to render and configure charts.

Spline Range Area Chart User Guide
Learn available options to customize the Xamarin.Forms spline range area chart.

150+ XAMARIN UI CONTROLS
-
Xamarin.Forms
-
Xamarin.Android
-
Xamarin.iOS
-
GRIDSDATA VISUALIZATIONNAVIGATIONEDITORSLAYOUTPROJECT MANAGEMENTNOTIFICATIONDOCUMENT PROCESSING LIBRARIESVIEWER/EDITORMISCELLANEOUSCHAT
-
GRIDSDATA VISUALIZATIONNAVIGATIONEDITORSLAYOUTPROJECT MANAGEMENTNOTIFICATIONVIEWER/EDITORDOCUMENT PROCESSING LIBRARIESMISCELLANEOUS
-
GRIDSDATA VISUALIZATIONNAVIGATIONEDITORSLAYOUTPROJECT MANAGEMENTNOTIFICATIONVIEWER/EDITORDOCUMENT PROCESSING LIBRARIESMISCELLANEOUS