Overview
The Xamarin.Forms scatter chart plots data with two numeric parameters. It also allows plotting multiple scatter series in a single chart to compare different datasets. It uses Cartesian coordinates to display values for typically two variables for a set of data.
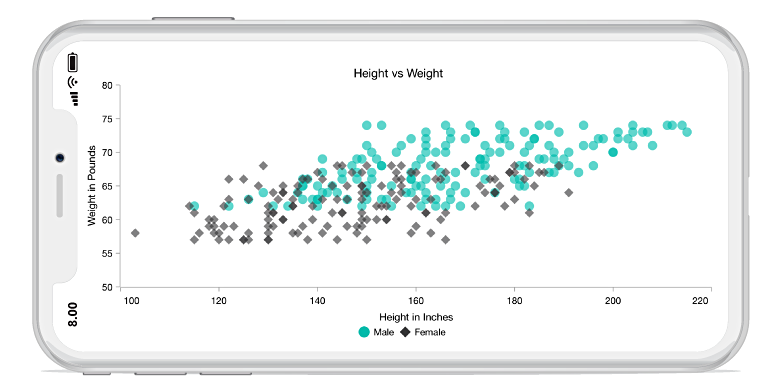
Key features
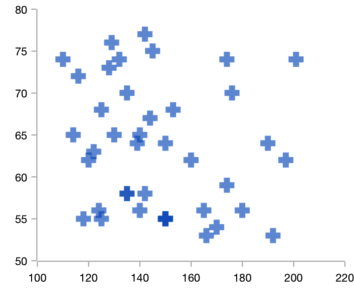
Shapes
Nine different shapes are available in scatter charts.
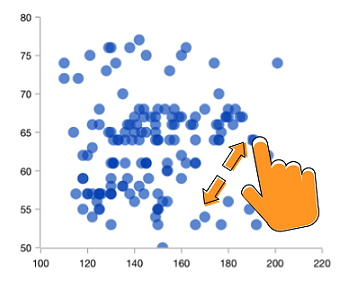
Zooming and panning
Supports zooming and panning to visualize data points in any region when dealing with large amount of data.
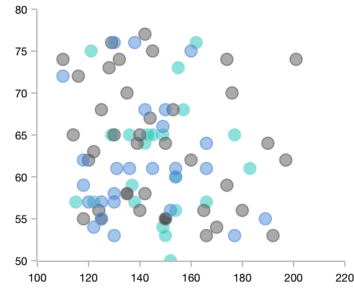
Customization
The look and feel of a scatter chart can be customized using built-in APIs.
Code example
Easily get started with Xamarin Scatter Chart using a few simple lines of C# code, as demonstrated below,
<?xml version="1.0" encoding="utf-8" ?>
<ContentPage xmlns="http://xamarin.com/schemas/2014/forms"
             xmlns:x="http://schemas.microsoft.com/winfx/2009/xaml"
             xmlns:local="clr-namespace:ChartExample"
             xmlns:chart="clr-namespace:Syncfusion.SfChart.XForms;assembly=Syncfusion.SfChart.XForms"
             x:Class="ChartExample.MainPage">

    <ContentPage.BindingContext>
        <local:ViewModel/>
    </ContentPage.BindingContext>

    <chart:SfChart>

        <chart:SfChart.PrimaryAxis>
            <chart:CategoryAxis/>
        </chart:SfChart.PrimaryAxis>

        <chart:SfChart.SecondaryAxis>
            <chart:NumericalAxis/>
        </chart:SfChart.SecondaryAxis>

        <chart:ScatterSeries ItemsSource="{Binding Data}" XBindingPath="Month" YBindingPath="Target" ScatterHeight="12" ScatterWidth="12"/>

    </chart:SfChart>

</ContentPage>
public class Model
{
public string Month { get; set; }
public double Target { get; set; }
public Model(string xValue, double yValue)
{
Month = xValue;
Target = yValue;
}
}
public class ViewModel
{
public ObservableCollection<Model> Data { get; set; }
public ViewModel()
{
Data = new ObservableCollection<Model>()
{
new Model("Jan", 50),
new Model("Feb", 70),
new Model("Mar", 65),
new Model("Apr", 57),
new Model("May", 48),
};
}
}Learning resources

Explore the Xamarin.Forms Scatter Chart example from GitHub to learn how to render and configure charts.


150+ XAMARIN UI CONTROLS
ALL CONTROLS
-
Xamarin.Forms
-
Xamarin.Android
-
Xamarin.iOS
-
GRIDSDATA VISUALIZATIONNAVIGATIONEDITORSLAYOUTPROJECT MANAGEMENTNOTIFICATIONDOCUMENT PROCESSING LIBRARIESVIEWER/EDITORMISCELLANEOUSCHAT
-
GRIDSDATA VISUALIZATIONNAVIGATIONEDITORSLAYOUTPROJECT MANAGEMENTNOTIFICATIONVIEWER/EDITORDOCUMENT PROCESSING LIBRARIESMISCELLANEOUS
-
GRIDSDATA VISUALIZATIONNAVIGATIONEDITORSLAYOUTPROJECT MANAGEMENTNOTIFICATIONVIEWER/EDITORDOCUMENT PROCESSING LIBRARIESMISCELLANEOUS
The most downloaded control (based on the nuget.org download count).