Overview
The Xamarin.Forms doughnut chart is a circular graphic, which is ideal for displaying proportional values in different categories. Doughnut chart supports animation and interactive features such as tooltip and selection.

Key features
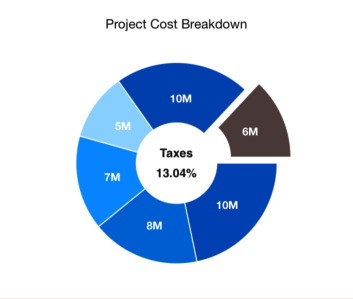
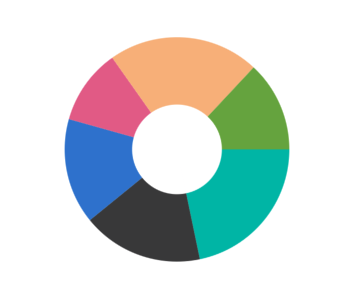
Center view
Any view can be added to the center of the doughnut chart.
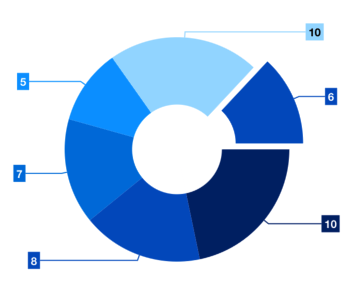
Explode on touch
Explode a single segment in the doughnut chart to differentiate it from others.
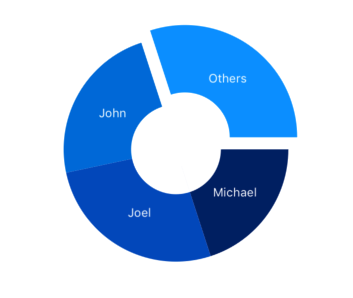
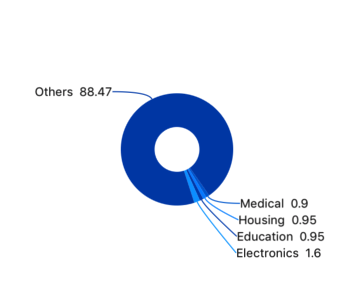
Grouping
Group the smaller segments in the doughnut chart to a single segment called “others”.
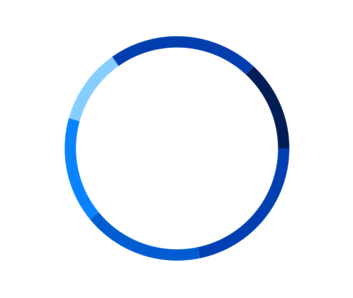
Custom inner radius
You can customize the inner radius of the chart to make it pleasing. Making inner radius to 0 will change the doughnut to pie chart. You can customize both the radius and inner radius of the doughnut.
Customization
Customize the look and feel of the doughnut using built-in APIs.
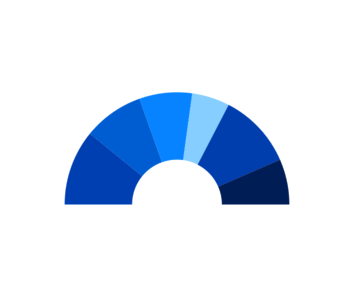
Start and End Angle
Customize the start and end angle of the chart to achieve the semi-pie.
Smart labels
Arranges data labels smartly to avoid overlapping when the data point values fall in close range.
Code example
Easily get started with the Xamarin Doughnut Chart using a few simple lines of C# code example as demonstrated below,
<?xml version="1.0" encoding="utf-8" ?>
<ContentPage xmlns="http://xamarin.com/schemas/2014/forms"
             xmlns:x="http://schemas.microsoft.com/winfx/2009/xaml"
             xmlns:local="clr-namespace:ChartExample"
             xmlns:chart="clr-namespace:Syncfusion.SfChart.XForms;assembly=Syncfusion.SfChart.XForms"
             x:Class="ChartExample.MainPage">

    <ContentPage.BindingContext>
        <local:ViewModel/>
    </ContentPage.BindingContext>

    <chart:SfChart>

        <chart:SfChart.Series>
            <chart:DoughnutSeries ItemsSource="{Binding Data}" XBindingPath="Month" YBindingPath="Target"/>
        </chart:SfChart.Series>

    </chart:SfChart>

</ContentPage>
public class Model
{
public string Month { get; set; }
public double Target { get; set; }
public Model(string xValue, double yValue)
{
Month = xValue;
Target = yValue;
}
}
public class ViewModel
{
public ObservableCollection<Model> Data { get; set; }
public ViewModel()
{
Data = new ObservableCollection<Model>()
{
new Model("Jan", 50),
new Model("Feb", 70),
new Model("Mar", 65),
new Model("Apr", 57),
new Model("May", 48),
};
}
}Learning resources

Explore the Xamarin.Forms Doughnut Chart example from GitHub to learn how to render and configure charts.


150+ XAMARIN UI CONTROLS
-
Xamarin.Forms
-
Xamarin.Android
-
Xamarin.iOS
-
GRIDSDATA VISUALIZATIONNAVIGATIONEDITORSLAYOUTPROJECT MANAGEMENTNOTIFICATIONDOCUMENT PROCESSING LIBRARIESVIEWER/EDITORMISCELLANEOUSCHAT
-
GRIDSDATA VISUALIZATIONNAVIGATIONEDITORSLAYOUTPROJECT MANAGEMENTNOTIFICATIONVIEWER/EDITORDOCUMENT PROCESSING LIBRARIESMISCELLANEOUS
-
GRIDSDATA VISUALIZATIONNAVIGATIONEDITORSLAYOUTPROJECT MANAGEMENTNOTIFICATIONVIEWER/EDITORDOCUMENT PROCESSING LIBRARIESMISCELLANEOUS