.NET MAUI Spark Charts - Visualize Trends with Lightweight Microcharts
- Use simple, lightweight charts that support line, column, area, and win/loss series types.
- Show trends and variations in a series of values, such as average temperature and stock prices.
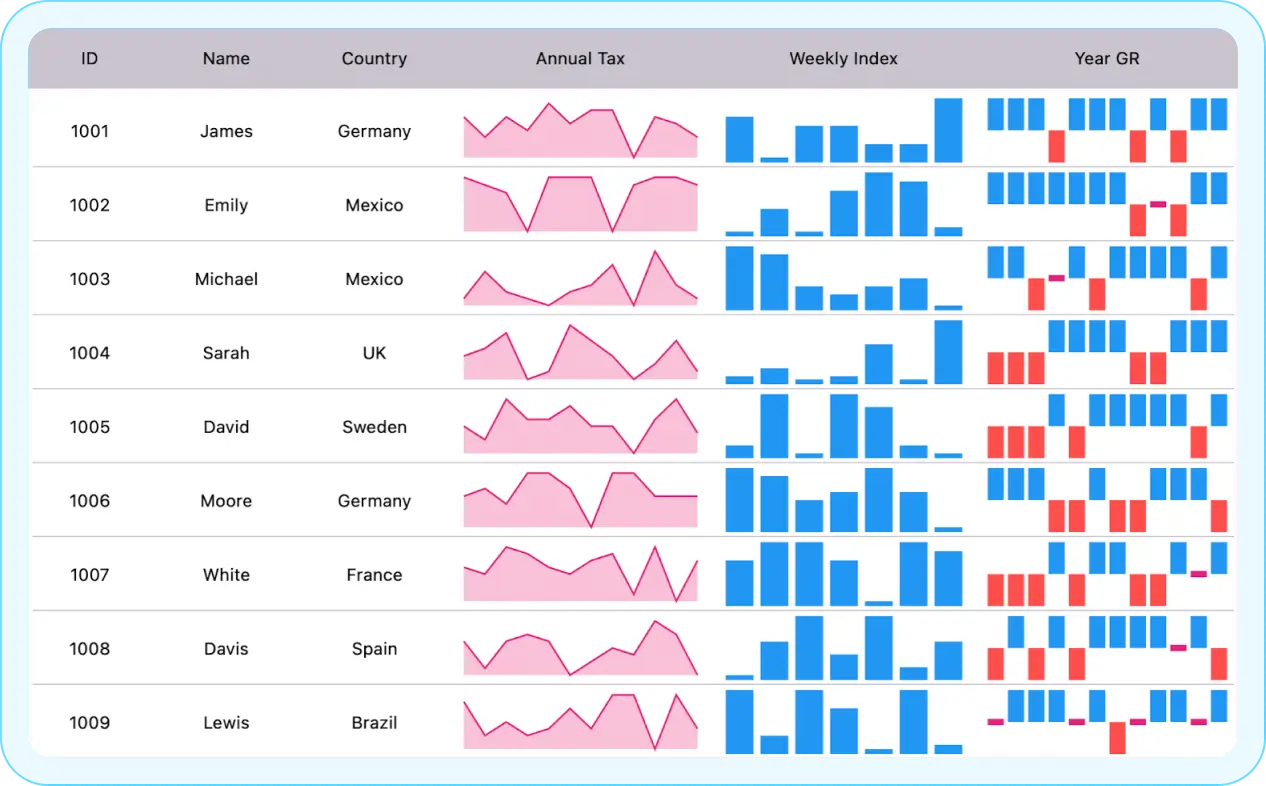
- Integrate with a data grid to visualize data trends in a small space.
Trusted by the world’s leading companies

Overview
The .NET MAUI spark charts are compact charts that help present trends and variations associated with measurements, such as average temperature or stock market activity, in a simple, lightweight, and condensed manner.
.NET MAUI spark chart code example
Get started with .NET MAUI spark charts by using a few simple lines of XAML code, as demonstrated below. Also, explore this .NET MAUI spark Charts Example, which shows you how to render and configure the component in .NET MAUI.
<?xml version="1.0" encoding="utf-8" ?>
<ContentPage xmlns="http://schemas.microsoft.com/dotnet/2021/maui"
             xmlns:x="http://schemas.microsoft.com/winfx/2009/xaml"
             xmlns:model="clr-namespace:SparkLineChartMaui"
             xmlns:spark="clr-namespace:Syncfusion.Maui.Toolkit.SparkCharts;assembly=Syncfusion.Maui.Toolkit"
             x:Class="SparkChartMaui.MainPage">
    <ContentPage.BindingContext>
            <model:ViewModel/>
        </ContentPage.BindingContext>
    <spark:SfSparkLineChart x:Name="SparkLineChart"
                             ItemsSource="{Binding Data}"
                             YBindingPath="YValue"/>
</ContentPage>
Spark chart types
There are four types of spark charts for showing data trends: line, column, area, and win/loss.
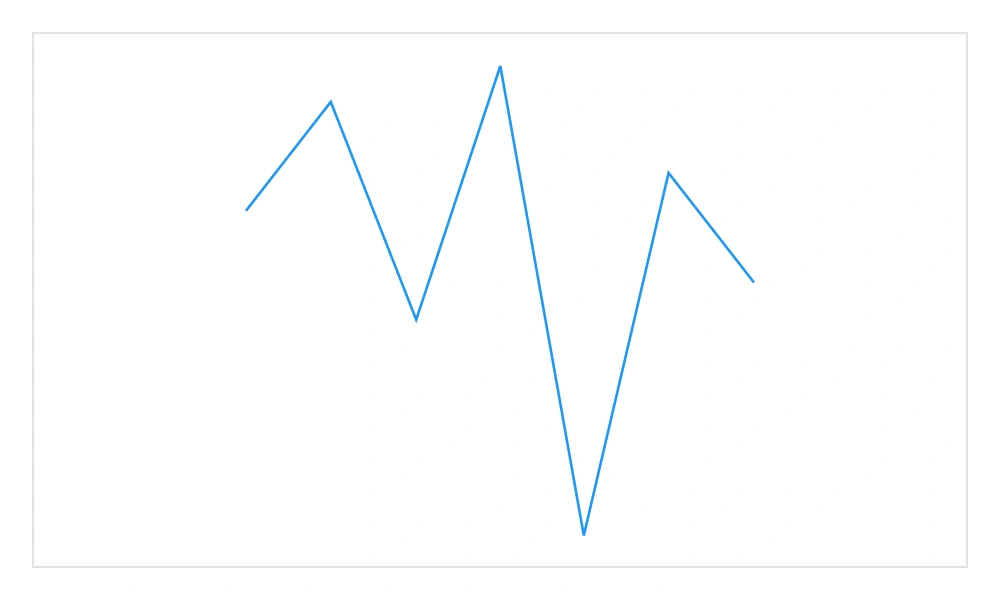
Spark line chart
A spark line chart displays data trends over time in a compact format, highlighting general patterns and fluctuations.
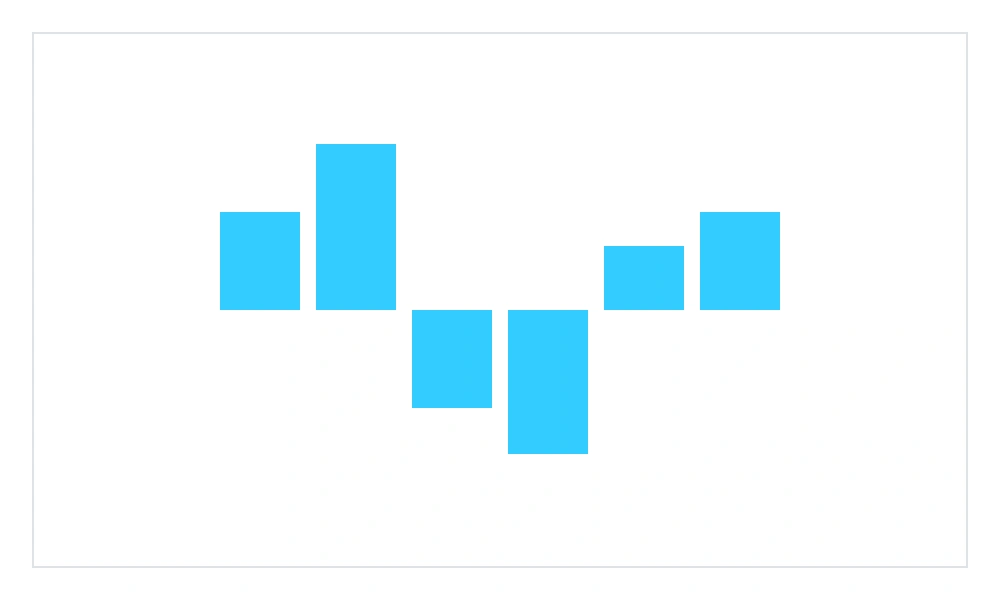
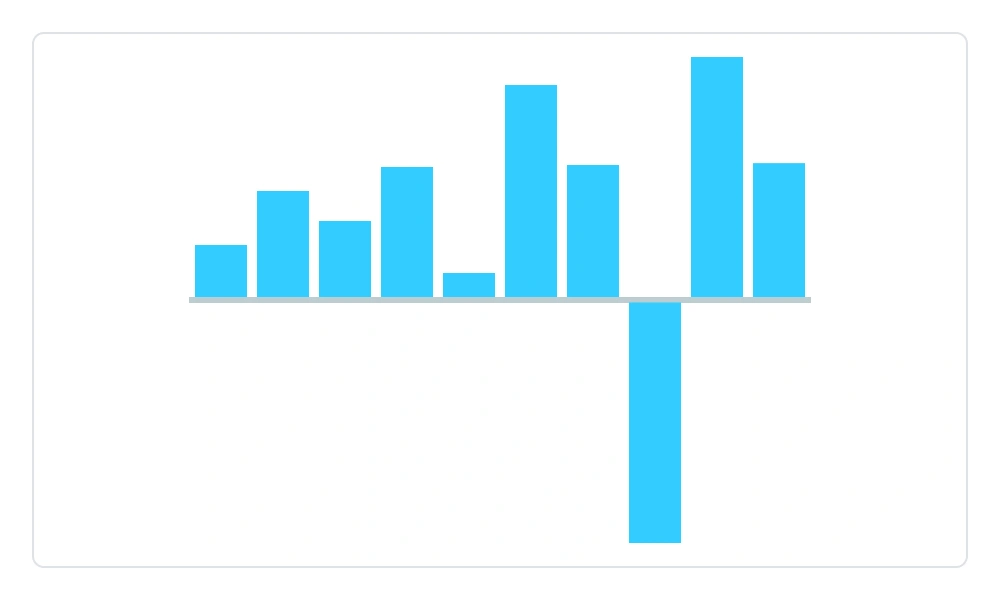
Spark column chart
A spark column chart compares values across two or more categories. Vertical bars represent the values.
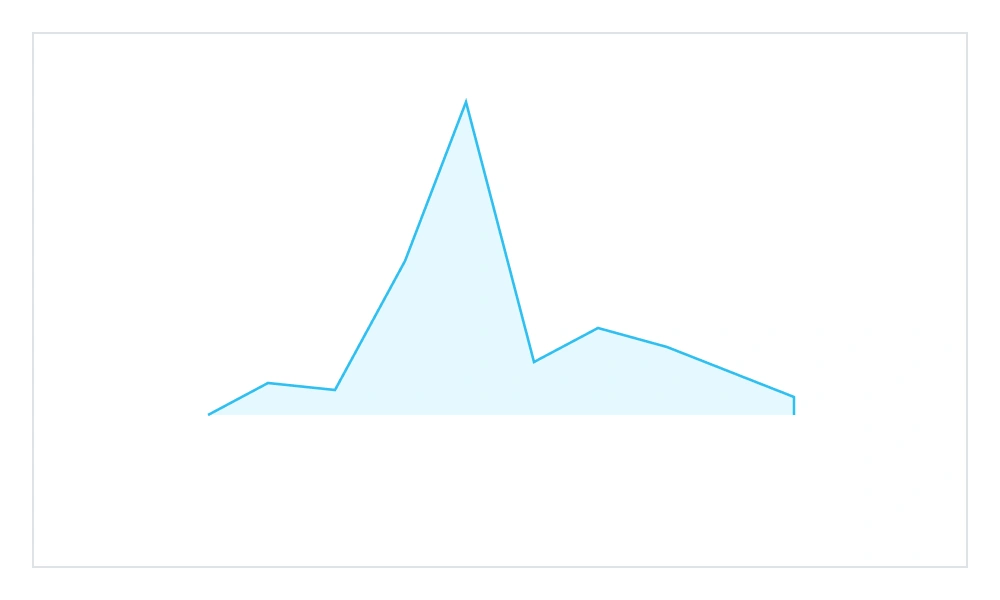
Spark area chart
An spark area chart is a line chart with the area under the line filled. It is primarily used when the magnitude of the trend is more important than individual data values.
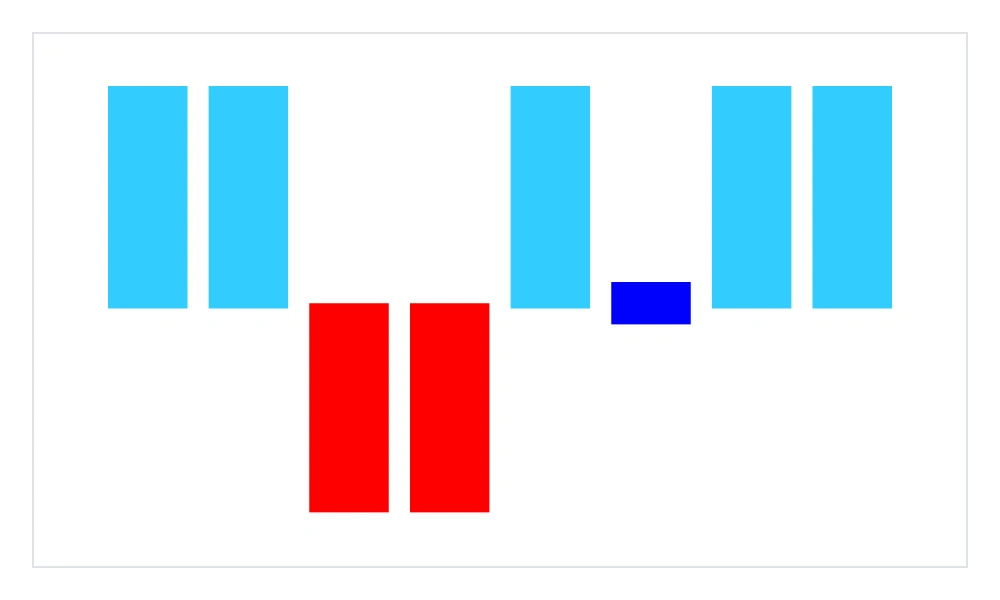
Spark win/loss chart
A spark win/loss chart visualizes win/loss scenarios, such as game results, showing whether each value is positive, negative, or zero.
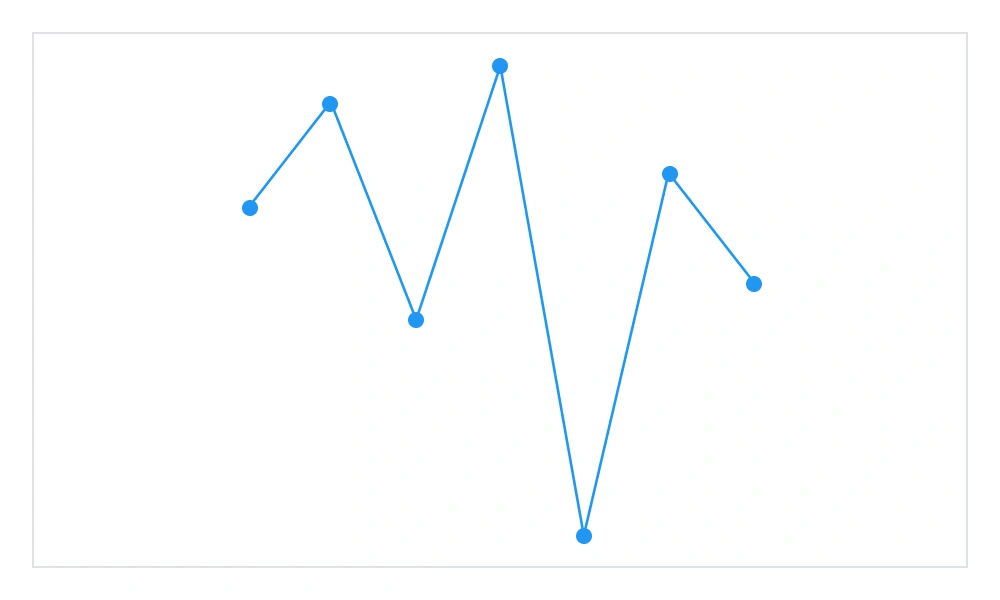
Markers
Markers are used to highlight data points in spark line and spark area charts to improve readability and emphazise trends.
Color customization
The default marker color is customizable to improve clarity.
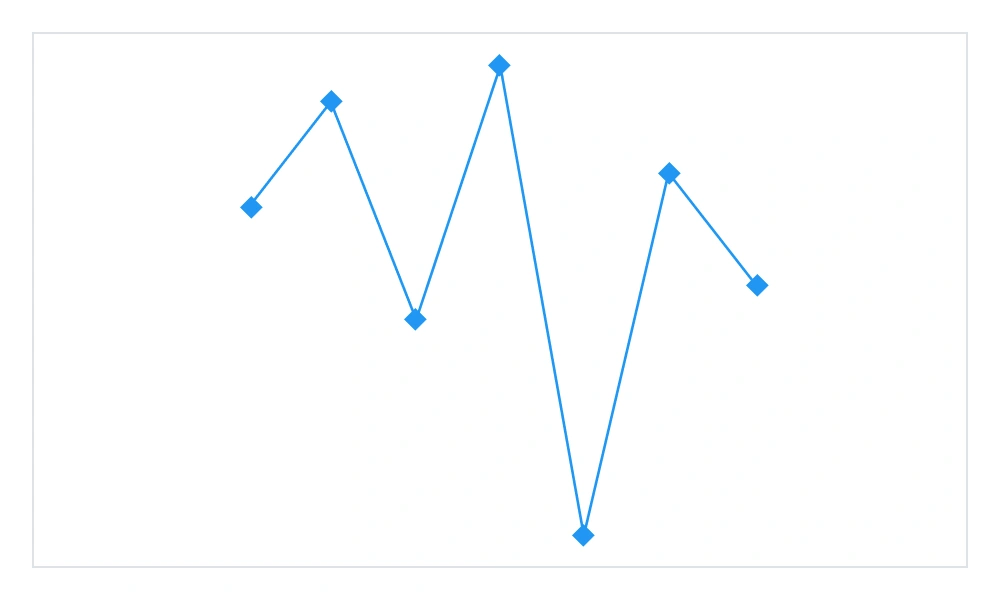
Type customization
The default marker type can be customized to enhance readability by using different types of markers.
Point highlighting
The colors of key data points, such as first, last, high, and low, can be highlighted and customized to emphasize their importance.
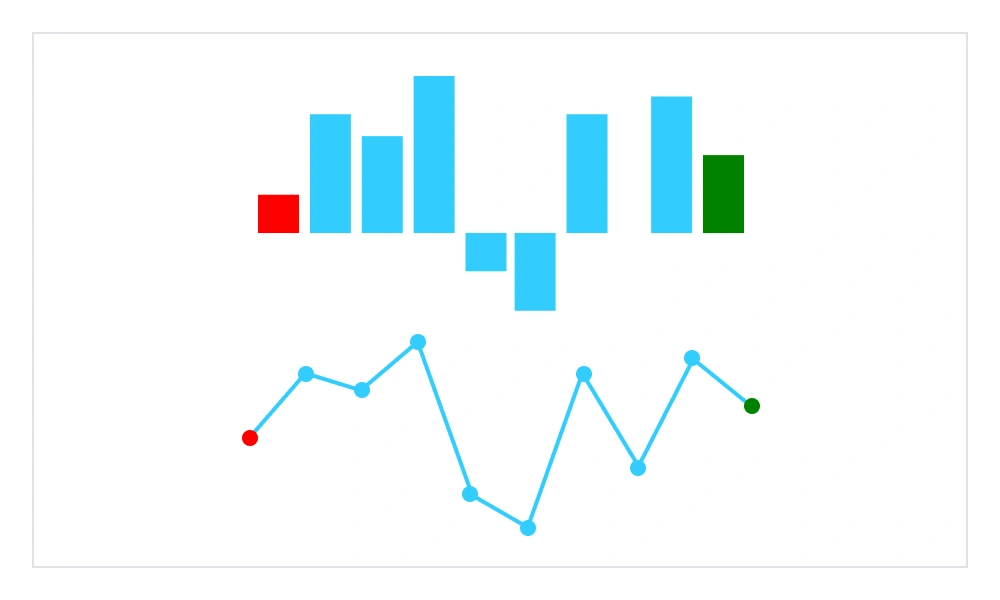
First and last point highlighting
The colors of the first and last points in a spark chart can be customized.
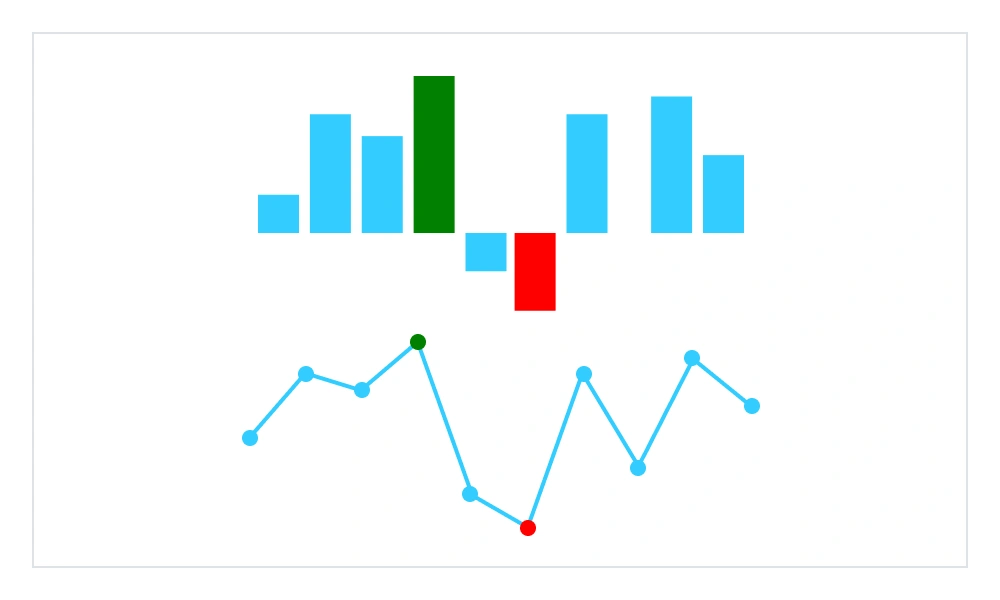
High and low point highlighting
The colors of the high and low points in a spark chart can be customized.
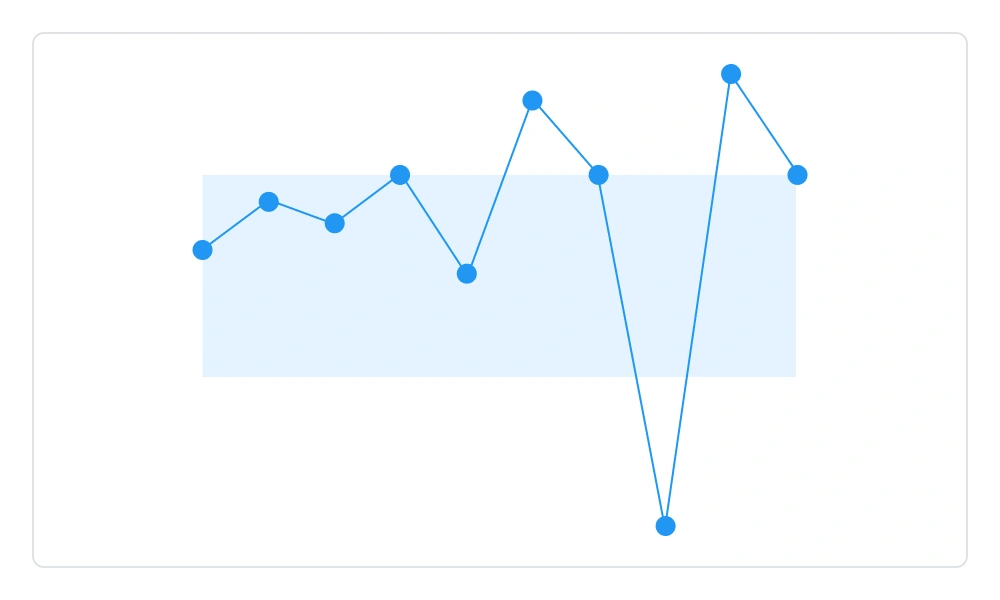
Range band
The range band highlights a specific region in the spark line to represent acceptable values. Set minimum and maximum limits to visually mark thresholds within the chart. Quickly spot outliers when data points fall outside the defined range.
Sparkline axis
The axis type feature in .NET MAUI defines how values are plotted along the horizontal (x) axis. While the vertical (y) axis always measures numeric values, the x-axis can adapt to different data contexts.
- Category axis: Displays each data point as a distinct group or label for categorical comparisons.
- DateTime axis: Plots values against time, making it easy to visualize chronological trends and changes.
- Numeric axis: Uses continuous numbers for the x-axis, suitable for ranges, indices, or quantitative sequences.
.NET MAUI DataViz & UI Controls
Standalone UI SDKs
Integrate the DataGrid, Chart, Scheduler, and Rich Text Editor UI components into applications to enable rich interaction and visualization, delivering a seamless user experience.
Document Solutions
Integrate the PDF Viewer, DOCX Editor, Spreadsheet Editor, and document-processing libraries into the .NET MAUI applications to enable a smooth user experience.
Our Customers Love Us


See Real Success Stories
Developers around the world trust Syncfusion’s Essential Studio to simplify complex projects and speed up delivery. With a vast library of UI controls, powerful SDKs, and reliable support, Essential Studio helps teams build enterprise-ready applications with confidence.
Read Our Customer StoriesIndustry
Software development
75% Cost reduction
50% Faster development
Industry
Utilities (oil and gas)
450+ hours saved
Streamlined processes and hours of development effort saved.
Advanced, flexible features
Empowered users through robust and versatile functionality.
Industry
Software and technology
1000+ of hours saved
Accelerated development with enterprise-ready UI components.
Efficient file management
Streamlined workflows with document libraries without building them from scratch.
Industry
Software and technology
2 Years of delay avoided
Two years of delays prevented with proactive planning.
On-time delivery
Projects delivered on schedule using trusted controls.
Industry
IT services and IT consulting
Improved performance
Large datasets handled with easy customization and quick debugging.
Highly customizable
Plug-and-play controls with quick template integration.
Industry
Professional services
Instant access
Quick availability of features and resources.
Reduced dependencies
Fewer dependencies for faster development.
Rated by users across the globe


Awards
Greatness—it’s one thing to say you have it, but it means more when others recognize it. Syncfusion® is proud to hold the following industry awards.

