Overview
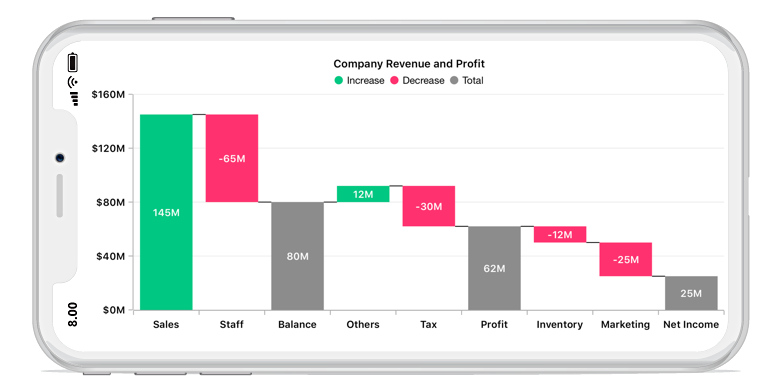
The Xamarin.Forms waterfall chart explains gradual changes in the quantitative value of an entity that is subject to changes by increments or decrements. Using the waterfall chart, you can quickly illustrate changes in revenues.
Key features
AutoSum
Calculate the sum of previous data points in the waterfall chart. If this property is disabled, use the specified ItemsSource collection’s y value.

UI customization
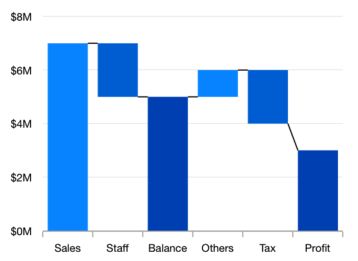
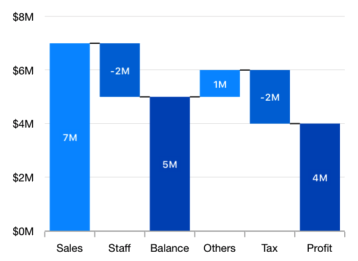
Customize the positive, negative, and summary segment colors of the waterfall chart by using built-in APIs to make it visually unique.
Data labels
Data points can easily be annotated with data labels to improve readability.
Code example
<?xml version="1.0" encoding="utf-8" ?>
<ContentPage xmlns="http://xamarin.com/schemas/2014/forms"
             xmlns:x="http://schemas.microsoft.com/winfx/2009/xaml"
             xmlns:local="clr-namespace:ChartExample"
             xmlns:chart="clr-namespace:Syncfusion.SfChart.XForms;assembly=Syncfusion.SfChart.XForms"
             x:Class="ChartExample.MainPage">

    <ContentPage.BindingContext>
        <local:ViewModel/>
    </ContentPage.BindingContext>

	<chart:SfChart>

		<chart:SfChart.PrimaryAxis>

			<chart:CategoryAxis />

		</chart:SfChart.PrimaryAxis>

		<chart:SfChart.SecondaryAxis>

			<chart:NumericalAxis />

		</chart:SfChart.SecondaryAxis>

		<chart:WaterfallSeries ItemsSource="{Binding Data}" XBindingPath="Category" YBindingPath="Value" SummaryBindingPath="IsSummary"/>

	</chart:SfChart>

</ContentPage>
public class Model
{
public string Category { get; set; }
public double Value { get; set; }
public bool IsSummary { get; set; }
public Model(string category, double value, bool isSummary)
{
Category = category;
Value = value;
IsSummary = isSummary;
}
}
public class ViewModel
{
public ObservableCollection<Model> Data { get; set; }
public ViewModel()
{
Data = new ObservableCollection<Model>()
{
new Model("Sales", 145, false),
new Model("Staff", -65, false),
new Model("Balance", 58, true),
new Model("Others", 12, false),
new Model("Tax", -30, false),
new Model("Profit", 45, true),
new Model("Inventory", -12, false),
new Model("Marketing", -25, false),
new Model("Net Income", 25, true),
};
}
}Learning resources


Learn the available options to customize the Xamarin.Forms waterfall chart.

150+ XAMARIN UI CONTROLS
ALL CONTROLS
-
Xamarin.Forms
-
Xamarin.Android
-
Xamarin.iOS
-
GRIDSDATA VISUALIZATIONNAVIGATIONEDITORSLAYOUTPROJECT MANAGEMENTNOTIFICATIONDOCUMENT PROCESSING LIBRARIESVIEWER/EDITORMISCELLANEOUSCHAT
-
GRIDSDATA VISUALIZATIONNAVIGATIONEDITORSLAYOUTPROJECT MANAGEMENTNOTIFICATIONVIEWER/EDITORDOCUMENT PROCESSING LIBRARIESMISCELLANEOUS
-
GRIDSDATA VISUALIZATIONNAVIGATIONEDITORSLAYOUTPROJECT MANAGEMENTNOTIFICATIONVIEWER/EDITORDOCUMENT PROCESSING LIBRARIESMISCELLANEOUS
The most downloaded control (based on the nuget.org download count).