Overview
The Xamarin.Forms 100% stacked line chart displays multiple series of data as stacked lines, ensuring that the cumulative proportion of each stacked element always totals 100%. Thus, the y-axis will always render within the range 0–100. This chart type is best suited for depicting the relative contribution of data points.

Key features
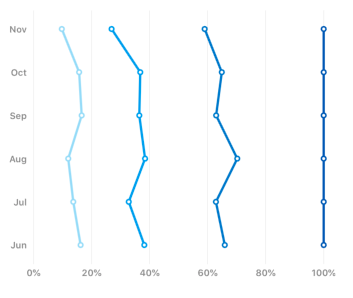
Vertical rendering
Rotate the stacked line 100 chart to plot data in a vertical direction and view data from a different perspective.

Marker
Marks data points with built-in shapes such as circles, rectangles, ellipses, vertical lines, horizontal lines, diamonds, triangles, and pentagons. In addition to these shapes, use images to make the point more attractive.
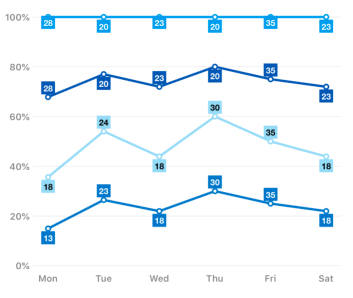
Data labels
Show the detail about the data points with the help of the data label support. Can place the label inside and outside of the chart. Use the connector line to connect the outside label with chart.

UI Customization
Customizes the color and line of a stacked line 100 chart using built-in APIs to make it visually unique.
Code example
<?xml version="1.0" encoding="utf-8" ?>
<ContentPage xmlns="http://xamarin.com/schemas/2014/forms"
             xmlns:x="http://schemas.microsoft.com/winfx/2009/xaml"
             xmlns:local="clr-namespace:ChartExample"
             xmlns:chart="clr-namespace:Syncfusion.SfChart.XForms;assembly=Syncfusion.SfChart.XForms"
             x:Class="ChartExample.MainPage">

    <ContentPage.BindingContext>
        <local:ViewModel/>
    </ContentPage.BindingContext>

	<chart:SfChart>

		<chart:SfChart.PrimaryAxis>

			<chart:CategoryAxis />

		</chart:SfChart.PrimaryAxis>

		<chart:SfChart.SecondaryAxis>

			<chart:NumericalAxis />

		</chart:SfChart.SecondaryAxis>

		<chart:StackingLine100Series ItemsSource="{Binding Data}" XBindingPath="Category" YBindingPath="Expense"/>

	</chart:SfChart>

</ContentPage>
public class Model
{
public string Category { get; set; }
public double Expense { get; set; }
public Model(string xValue, double yValue)
{
Category = xValue;
Expense = yValue;
}
}
public class ViewModel
{
public ObservableCollection<Model> Data { get; set; }
public ViewModel()
{
Data = new ObservableCollection<Model>()
{
new Model("Food", 88),
new Model("Transport", 75),
new Model("Medical", 68),
new Model("Clothes", 70),
new Model("Books", 65),
new Model("Others", 73),
};
}
}Learning resources


100% Stacked Line Chart User Guide
Learn available options to customize the Xamarin.Forms 100% stacked line chart.

150+ XAMARIN UI CONTROLS
-
Xamarin.Forms
-
Xamarin.Android
-
Xamarin.iOS
-
GRIDSDATA VISUALIZATIONNAVIGATIONEDITORSLAYOUTPROJECT MANAGEMENTNOTIFICATIONDOCUMENT PROCESSING LIBRARIESVIEWER/EDITORMISCELLANEOUSCHAT
-
GRIDSDATA VISUALIZATIONNAVIGATIONEDITORSLAYOUTPROJECT MANAGEMENTNOTIFICATIONVIEWER/EDITORDOCUMENT PROCESSING LIBRARIESMISCELLANEOUS
-
GRIDSDATA VISUALIZATIONNAVIGATIONEDITORSLAYOUTPROJECT MANAGEMENTNOTIFICATIONVIEWER/EDITORDOCUMENT PROCESSING LIBRARIESMISCELLANEOUS