Overview
The Xamarin.Forms spline chart resembles a line chart, but the difference between them is that instead of connecting the data points with straight lines, the data points are connected by smooth Bezier curves.

Key features
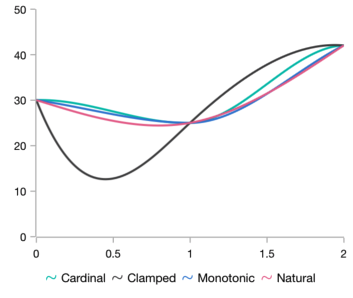
Spline type
Four different types of rendering such as natural, monotonic, cardinal, and clamped.
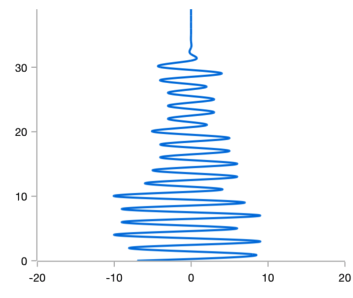
Vertical rendering
Rotate the spline chart to plot data in a vertical direction and view data from a different perspective.
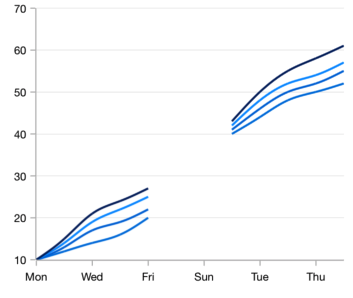
Empty points
Empty or null data points are elegantly handled in spline charts.

Marker
Marks data points with built-in shapes such as circles, rectangles, ellipses, vertical lines, horizontal lines, diamonds, triangles, and pentagons. In addition to these shapes, use images to make the point more attractive.
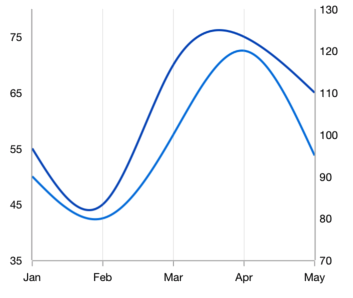
Multiple axes
Use multiple axes to plot different data sets that widely vary from one other.
Code example
Easily get started with Xamarin Spline Chart using a few simple lines of C# code, as demonstrated below,
<?xml version="1.0" encoding="utf-8" ?>
<ContentPage xmlns="http://xamarin.com/schemas/2014/forms"
             xmlns:x="http://schemas.microsoft.com/winfx/2009/xaml"
             xmlns:local="clr-namespace:ChartExample"
             xmlns:chart="clr-namespace:Syncfusion.SfChart.XForms;assembly=Syncfusion.SfChart.XForms"
             x:Class="ChartExample.MainPage">

    <ContentPage.BindingContext>
        <local:ViewModel/>
    </ContentPage.BindingContext>

    <chart:SfChart>

        <chart:SfChart.PrimaryAxis>
            <chart:CategoryAxis/>
        </chart:SfChart.PrimaryAxis>

        <chart:SfChart.SecondaryAxis>
            <chart:NumericalAxis/>
        </chart:SfChart.SecondaryAxis>

        <chart:SplineSeries ItemsSource="{Binding Data}" XBindingPath="Month" YBindingPath="Target"/>

    </chart:SfChart>

</ContentPage>
public class Model
{
public string Month { get; set; }
public double Target { get; set; }
public Model(string xValue, double yValue)
{
Month = xValue;
Target = yValue;
}
}
public class ViewModel
{
public ObservableCollection<Model> Data { get; set; }
public ViewModel()
{
Data = new ObservableCollection<Model>()
{
new Model("Jan", 50),
new Model("Feb", 70),
new Model("Mar", 65),
new Model("Apr", 57),
new Model("May", 48),
};
}
}Learning resources

Explore the Xamarin.Forms Spline Chart example from GitHub to learn how to render and configure charts.


150+ XAMARIN UI CONTROLS
-
Xamarin.Forms
-
Xamarin.Android
-
Xamarin.iOS
-
GRIDSDATA VISUALIZATIONNAVIGATIONEDITORSLAYOUTPROJECT MANAGEMENTNOTIFICATIONDOCUMENT PROCESSING LIBRARIESVIEWER/EDITORMISCELLANEOUSCHAT
-
GRIDSDATA VISUALIZATIONNAVIGATIONEDITORSLAYOUTPROJECT MANAGEMENTNOTIFICATIONVIEWER/EDITORDOCUMENT PROCESSING LIBRARIESMISCELLANEOUS
-
GRIDSDATA VISUALIZATIONNAVIGATIONEDITORSLAYOUTPROJECT MANAGEMENTNOTIFICATIONVIEWER/EDITORDOCUMENT PROCESSING LIBRARIESMISCELLANEOUS