Overview
The Xamarin.Forms range column chart is used to display a range of data by plotting two y-values per data point. Each y-value used in the range column chart is drawn as the upper and lower bounds of a column.

Key features
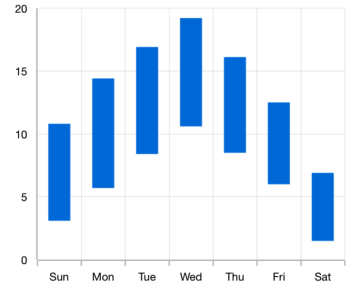
Spacing and width
The range column chart provides an option to customize the spacing between two rectangles.
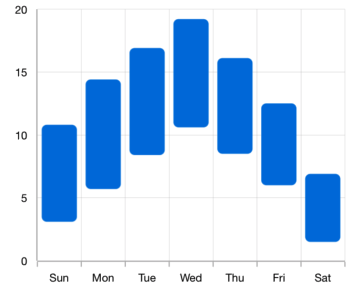
Corner radius
Modernize the UI by applying rounded corners to the range column chart.
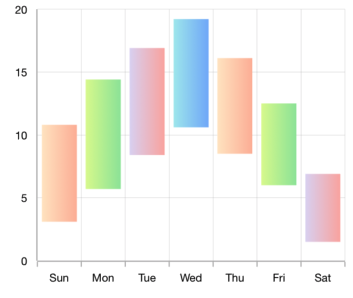
Gradient
Applies gradient colors to visualize data in different colors, improving the readability and appearance of a chart.
Code example
Easily get started with Xamarin Range Column Chart using a few simple lines of C# code, as demonstrated below,
<?xml version="1.0" encoding="utf-8" ?>
<ContentPage xmlns="http://xamarin.com/schemas/2014/forms"
             xmlns:x="http://schemas.microsoft.com/winfx/2009/xaml"
             xmlns:local="clr-namespace:ChartExample"
             xmlns:chart="clr-namespace:Syncfusion.SfChart.XForms;assembly=Syncfusion.SfChart.XForms"
             x:Class="ChartExample.MainPage">

    <ContentPage.BindingContext>
        <local:ViewModel/>
    </ContentPage.BindingContext>

    <chart:SfChart>

        <chart:SfChart.PrimaryAxis>
            <chart:CategoryAxis/>
        </chart:SfChart.PrimaryAxis>

        <chart:SfChart.SecondaryAxis>
            <chart:NumericalAxis/>
        </chart:SfChart.SecondaryAxis>

        <chart:RangeColumnSeries ItemsSource="{Binding Data}" XBindingPath="Month" High="High" Low="Low"/>

    </chart:SfChart>

</ContentPage>
public class Model
{
public string Month { get; set; }
public double High { get; set; }
public double Low { get; set; }
public Model(string xValue, double high, double low)
{
Month = xValue;
High = high;
Low = low;
}
}
public class ViewModel
{
public ObservableCollection<Model> Data { get; set; }
public ViewModel()
{
Data = new ObservableCollection<Model>()
{
new Model("Jan", 50, 12),
new Model("Feb", 70, 13),
new Model("Mar", 65, 14),
new Model("Apr", 57, 15),
new Model("May", 48, 10),
};
}
}Learning resources

Explore the Xamarin.Forms Range Column Chart example from GitHub to learn how to render and configure charts.

Learn available options to customize the Xamarin.Forms range column chart.

150+ XAMARIN UI CONTROLS
-
Xamarin.Forms
-
Xamarin.Android
-
Xamarin.iOS
-
GRIDSDATA VISUALIZATIONNAVIGATIONEDITORSLAYOUTPROJECT MANAGEMENTNOTIFICATIONDOCUMENT PROCESSING LIBRARIESVIEWER/EDITORMISCELLANEOUSCHAT
-
GRIDSDATA VISUALIZATIONNAVIGATIONEDITORSLAYOUTPROJECT MANAGEMENTNOTIFICATIONVIEWER/EDITORDOCUMENT PROCESSING LIBRARIESMISCELLANEOUS
-
GRIDSDATA VISUALIZATIONNAVIGATIONEDITORSLAYOUTPROJECT MANAGEMENTNOTIFICATIONVIEWER/EDITORDOCUMENT PROCESSING LIBRARIESMISCELLANEOUS