Overview
The Xamarin.Forms pyramid chart is the form of a triangle with lines dividing it into sections, each section with a different width. Depending on the Y coordinates, this width indicates a level of hierarchy among other categories.

Key features
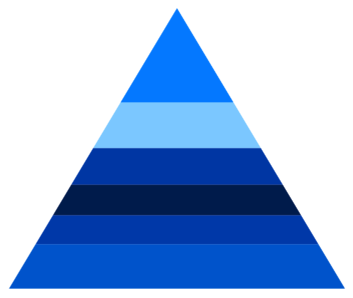
Pyramid mode
The pyramid chart supports two types of visualization mode, linear and surface. The Y value is represented by the height of the rectangle in linear mode and area of the rectangle in surface mode.
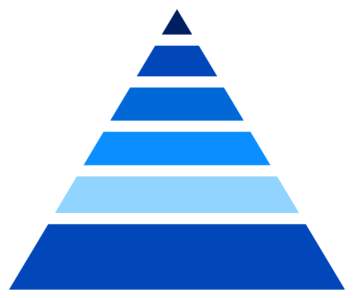
Segment gap
The segments in the pyramid chart can be separated by gaps to highlight the levels in the hierarchy.
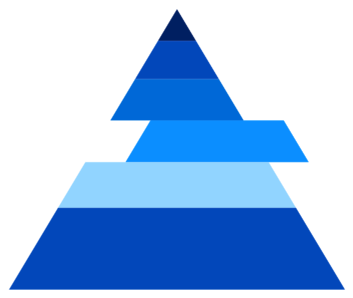
Exploding on touch
Explode a single segment in the pyramid chart to differentiate it from others.
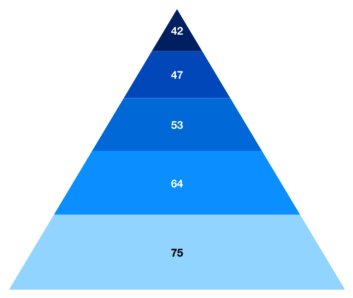
Data label
Show the detail about the data points with the help of data label support. Can place the label inside and outside of the chart. Use the connector line to connect the outside label with chart.
Code example
Easily get started with Xamarin Pyramid Chart using a few simple lines of C# code, as demonstrated below,
<?xml version="1.0" encoding="utf-8" ?>
<ContentPage xmlns="http://xamarin.com/schemas/2014/forms"
             xmlns:x="http://schemas.microsoft.com/winfx/2009/xaml"
             xmlns:local="clr-namespace:ChartExample"
             xmlns:chart="clr-namespace:Syncfusion.SfChart.XForms;assembly=Syncfusion.SfChart.XForms"
             x:Class="ChartExample.MainPage">

    <ContentPage.BindingContext>
        <local:ViewModel/>
    </ContentPage.BindingContext>

    <chart:SfChart>

        <chart:SfChart.Series>
            <chart:PyramidSeries ItemsSource="{Binding Data}" XBindingPath="Month" YBindingPath="Target"/>
        </chart:SfChart.Series>

    </chart:SfChart>

</ContentPage>
public class Model
{
public string Month { get; set; }
public double Target { get; set; }
public Model(string xValue, double yValue)
{
Month = xValue;
Target = yValue;
}
}
public class ViewModel
{
public ObservableCollection<Model> Data { get; set; }
public ViewModel()
{
Data = new ObservableCollection<Model>()
{
new Model("Jan", 50),
new Model("Feb", 70),
new Model("Mar", 65),
new Model("Apr", 57),
new Model("May", 48),
};
}
}Learning resources

Explore the Xamarin.Forms Pyramid Chart example from GitHub to learn how to render and configure charts.


150+ XAMARIN UI CONTROLS
-
Xamarin.Forms
-
Xamarin.Android
-
Xamarin.iOS
-
GRIDSDATA VISUALIZATIONNAVIGATIONEDITORSLAYOUTPROJECT MANAGEMENTNOTIFICATIONDOCUMENT PROCESSING LIBRARIESVIEWER/EDITORMISCELLANEOUSCHAT
-
GRIDSDATA VISUALIZATIONNAVIGATIONEDITORSLAYOUTPROJECT MANAGEMENTNOTIFICATIONVIEWER/EDITORDOCUMENT PROCESSING LIBRARIESMISCELLANEOUS
-
GRIDSDATA VISUALIZATIONNAVIGATIONEDITORSLAYOUTPROJECT MANAGEMENTNOTIFICATIONVIEWER/EDITORDOCUMENT PROCESSING LIBRARIESMISCELLANEOUS