Overview
The Xamarin.Forms line chart represents and visualizes time-dependent data to show the trends at equal intervals. It supports numeric, category, date-time, or logarithmic axis of a graph, and works well with large amount of data with animation, zooming, and panning support.

Key features
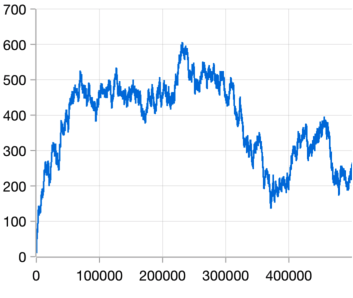
Fast line
Displays thousands of data within a few seconds. Experience smooth interactions.
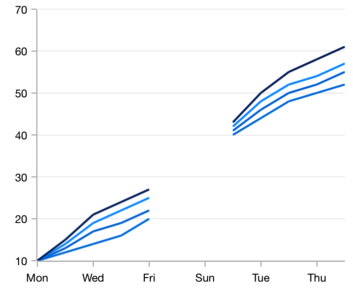
Empty point
Empty or null data points are elegantly handled in a line chart.
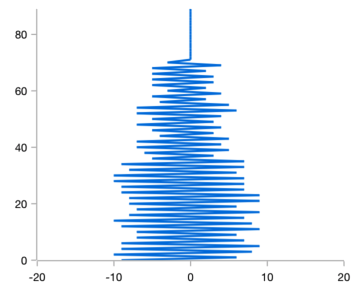
Vertical line
Rotate the line chart to plot data in a vertical direction and view data from a different perspective.
Marker
Marks data points with built-in shapes such as circles, rectangles, ellipses, vertical lines, horizontal lines, diamonds, triangles, and pentagons. In addition to these shapes, use images to make the point more attractive.
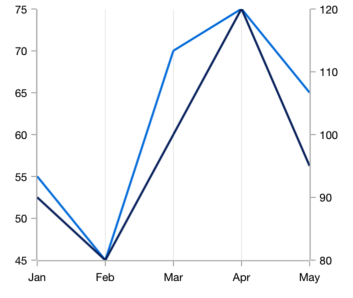
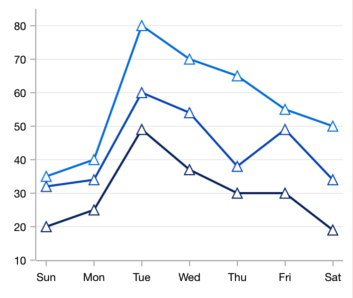
Multiple axes
Use multiple axes to plot different data sets that widely vary from one other.
Code example
Easily get started with Xamarin Line Chart using a few simple lines of C# code, as demonstrated below,
<?xml version="1.0" encoding="utf-8" ?>
<ContentPage xmlns="http://xamarin.com/schemas/2014/forms"
             xmlns:x="http://schemas.microsoft.com/winfx/2009/xaml"
             xmlns:local="clr-namespace:ChartExample"
             xmlns:chart="clr-namespace:Syncfusion.SfChart.XForms;assembly=Syncfusion.SfChart.XForms"
             x:Class="ChartExample.MainPage">

    <ContentPage.BindingContext>
        <local:ViewModel/>
    </ContentPage.BindingContext>

    <chart:SfChart>

        <chart:SfChart.PrimaryAxis>
            <chart:CategoryAxis/>
        </chart:SfChart.PrimaryAxis>

        <chart:SfChart.SecondaryAxis>
            <chart:NumericalAxis/>
        </chart:SfChart.SecondaryAxis>

        <chart:LineSeries ItemsSource="{Binding Data}" XBindingPath="Month" YBindingPath="Target"/>

    </chart:SfChart>

</ContentPage>
public class Model
{
public string Month { get; set; }
public double Target { get; set; }
public Model(string xValue, double yValue)
{
Month = xValue;
Target = yValue;
}
}
public class ViewModel
{
public ObservableCollection<Model> Data { get; set; }
public ViewModel()
{
Data = new ObservableCollection<Model>()
{
new Model("Jan", 50),
new Model("Feb", 70),
new Model("Mar", 65),
new Model("Apr", 57),
new Model("May", 48),
};
}
}Learning resources

Explore the Xamarin.Forms Line Chart example from GitHub to learn how to render and configure charts.


150+ XAMARIN UI CONTROLS
-
Xamarin.Forms
-
Xamarin.Android
-
Xamarin.iOS
-
GRIDSDATA VISUALIZATIONNAVIGATIONEDITORSLAYOUTPROJECT MANAGEMENTNOTIFICATIONDOCUMENT PROCESSING LIBRARIESVIEWER/EDITORMISCELLANEOUSCHAT
-
GRIDSDATA VISUALIZATIONNAVIGATIONEDITORSLAYOUTPROJECT MANAGEMENTNOTIFICATIONVIEWER/EDITORDOCUMENT PROCESSING LIBRARIESMISCELLANEOUS
-
GRIDSDATA VISUALIZATIONNAVIGATIONEDITORSLAYOUTPROJECT MANAGEMENTNOTIFICATIONVIEWER/EDITORDOCUMENT PROCESSING LIBRARIESMISCELLANEOUS