Overview
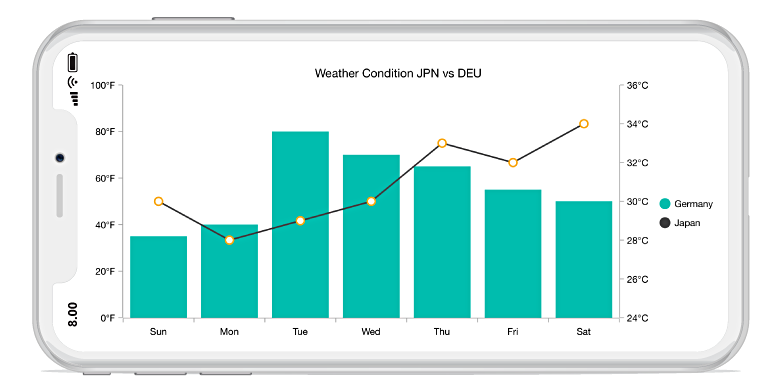
The Xamarin.Forms combination chart visualizes data by combining two or more charts into a single chart. You can visualize two different kinds of data correlated in a meaningful way, i.e., revenue vs profit.
Key features
Multiple axes
Plot different units of data using multiple axes in a single chart. It can be positioned at either side of the chart.

Color palette
Efficiently handle the colors of multiple charts using the color palette.

Interactive features
Experience smooth interaction in combination charts using built-in interactive features.
Code example
Easily get started with the Xamarin.Forms Combination Chart using a few simple lines of C# code example as demonstrated below,
<ContentPage xmlns="http://xamarin.com/schemas/2014/forms"
             xmlns:x="http://schemas.microsoft.com/winfx/2009/xaml"
             xmlns:local="clr-namespace:ChartExample"
             xmlns:chart="clr-namespace:Syncfusion.SfChart.XForms;assembly=Syncfusion.SfChart.XForms"
             x:Class="ChartExample.MainPage">

    <ContentPage.BindingContext>
        <local:ViewModel/>
    </ContentPage.BindingContext>

	<chart:SfChart>

		<chart:SfChart.PrimaryAxis>
			<chart:CategoryAxis/>
		</chart:SfChart.PrimaryAxis>

		<chart:SfChart.SecondaryAxis>
			<chart:NumericalAxis/>
		</chart:SfChart.SecondaryAxis>

		<chart:AreaSeries ItemsSource="{Binding AreaData}" XBindingPath="Month" YBindingPath="Target"/>

		<chart:ColumnSeries ItemsSource="{Binding ColumnData}" XBindingPath="Month" YBindingPath="Target"/>

	</chart:SfChart>

</ContentPage>
public class Model
{
public string Month { get; set; }
public double Target { get; set; }
public Model(string xValue, double yValue)
{
Month = xValue;
Target = yValue;
}
}
public class ViewModel
{
public ObservableCollection<Model> AreaData { get; set; }
public ObservableCollection<Model> ColumnData { get; set; }
public ViewModel()
{
AreaData = new ObservableCollection<Model>()
{
new Model("Jan", 50),
new Model("Feb", 70),
new Model("Mar", 65),
new Model("Apr", 57),
new Model("May", 48),
};
ColumnData = new ObservableCollection<Model>()
{
new Model("Jan", 20),
new Model("Feb", 30),
new Model("Mar", 25),
new Model("Apr", 47),
new Model("May", 38),
};
}
}Learning resources

Explore the Xamarin.Forms Combination Chart example from GitHub to learn how to render and configure charts.

150+ XAMARIN UI CONTROLS
ALL CONTROLS
-
Xamarin.Forms
-
Xamarin.Android
-
Xamarin.iOS
-
GRIDSDATA VISUALIZATIONNAVIGATIONEDITORSLAYOUTPROJECT MANAGEMENTNOTIFICATIONDOCUMENT PROCESSING LIBRARIESVIEWER/EDITORMISCELLANEOUSCHAT
-
GRIDSDATA VISUALIZATIONNAVIGATIONEDITORSLAYOUTPROJECT MANAGEMENTNOTIFICATIONVIEWER/EDITORDOCUMENT PROCESSING LIBRARIESMISCELLANEOUS
-
GRIDSDATA VISUALIZATIONNAVIGATIONEDITORSLAYOUTPROJECT MANAGEMENTNOTIFICATIONVIEWER/EDITORDOCUMENT PROCESSING LIBRARIESMISCELLANEOUS
The most downloaded control (based on the nuget.org download count).