Overview
The Xamarin.Forms column chart uses vertical bars (called columns) to display different values of one or more items. Column chart is the most common chart types that are being used. It is like a bar chart except that here the bars are vertical and not horizontal. Points from adjacent series are drawn as bars next to each other.

Key features
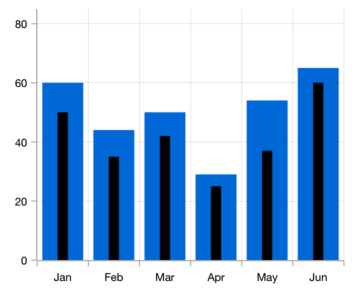
Overlapping bars
Compare two different types of relational values using bar chart that overlap one another in Xamarin.Forms.
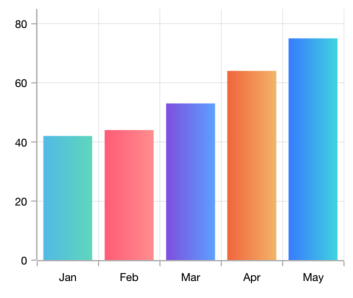
Gradient
Applies gradient colors to visualize data in different colors, improving the readability and appearance of the chart.

Corner radius
Modernize the UI by applying rounded corners to the bar chart.
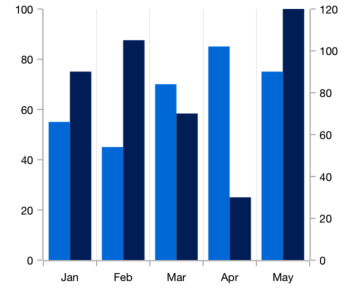
Multiple axes
Use multiple axes to plot different data sets that widely vary from one other.
Code example
Easily get started with the Xamarin Column Chart using a few simple lines of C# code example as demonstrated below,
<ContentPage xmlns="http://xamarin.com/schemas/2014/forms"
             xmlns:x="http://schemas.microsoft.com/winfx/2009/xaml"
             xmlns:local="clr-namespace:ChartExample"
             xmlns:chart="clr-namespace:Syncfusion.SfChart.XForms;assembly=Syncfusion.SfChart.XForms"
             x:Class="ChartExample.MainPage">

    <ContentPage.BindingContext>
        <local:ViewModel/>
    </ContentPage.BindingContext>

    <chart:SfChart>

        <chart:SfChart.PrimaryAxis>
            <chart:CategoryAxis/>
        </chart:SfChart.PrimaryAxis>

        <chart:SfChart.SecondaryAxis>
            <chart:NumericalAxis/>
        </chart:SfChart.SecondaryAxis>

        <chart:ColumnSeries ItemsSource="{Binding Data}" XBindingPath="Month" YBindingPath="Target"/>

    </chart:SfChart>

</ContentPage>
public class Model
{
public string Month { get; set; }
public double Target { get; set; }
public Model(string xValue, double yValue)
{
Month = xValue;
Target = yValue;
}
}
public class ViewModel
{
public ObservableCollection<Model> Data { get; set; }
public ViewModel()
{
Data = new ObservableCollection<Model>()
{
new Model("Jan", 50),
new Model("Feb", 70),
new Model("Mar", 65),
new Model("Apr", 57),
new Model("May", 48),
};
}
}Learning resources

Explore the Xamarin.Forms Column Chart example from GitHub to learn how to render and configure charts.


150+ XAMARIN UI CONTROLS
-
Xamarin.Forms
-
Xamarin.Android
-
Xamarin.iOS
-
GRIDSDATA VISUALIZATIONNAVIGATIONEDITORSLAYOUTPROJECT MANAGEMENTNOTIFICATIONDOCUMENT PROCESSING LIBRARIESVIEWER/EDITORMISCELLANEOUSCHAT
-
GRIDSDATA VISUALIZATIONNAVIGATIONEDITORSLAYOUTPROJECT MANAGEMENTNOTIFICATIONVIEWER/EDITORDOCUMENT PROCESSING LIBRARIESMISCELLANEOUS
-
GRIDSDATA VISUALIZATIONNAVIGATIONEDITORSLAYOUTPROJECT MANAGEMENTNOTIFICATIONVIEWER/EDITORDOCUMENT PROCESSING LIBRARIESMISCELLANEOUS